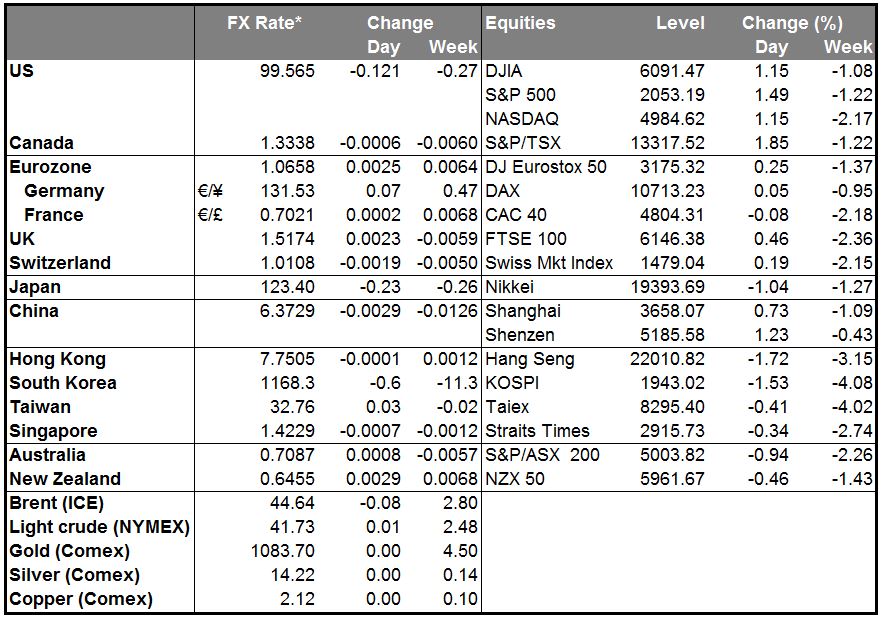
• Dollar regains momentum on Fed-hike bets The dollar index, which tracks the USD against six major counterparts, rose to its highest level since mid-April as investors shifted their focus from the Paris tragedy to Fed’s rate hike expectations. Later in the day, the US CPI data for October is due to be released with investors eager to see a modest rise in the inflation rate. Following the astonishing surge in the NFP for October and the overall strong employment report, even a fractional improvement in the data is likely to amplify the case for a December rate hike and strengthen the greenback further. In the adverse scenario of a disappointing figure, the dollar could give back some of its recent gains.
• Overnight, the Reserve Bank of Australia released the minutes of its most recent policy meeting. At this meeting, the Bank kept official interest rates unchanged amid signs of improvement of business conditions over the past year and a somewhat stronger growth in employment. Although in the minutes the Bank said that low inflation may afford scope for further easing of policy, the prospects for an improvement in economic conditions had firmed a little over the recent months. As a result, it was appropriate to leave the cash rate unchanged at this meeting. Within this context, AUD/USD was little changed as the minutes had a similar tone with the statement accompanying the rate decision. We maintain our bearish AUD view because the surrounding structural conditions remain unchanged. China is facing an economic slowdown and the Australian economy is still in the process of rebalancing.
Elsewhere, New Zealand’s 2yr inflation expectations for Q4 declined to 1.85% from 1.94% previously. This added to the soft data coming out from the country and increased expectations for another rate cut at their December meeting. The focus now turns to the GlobalDairyTrade auction later today, where prices look set to head lower. NZD/USD fell below the psychological barrier of 0.6500 and is poised to head lower if we see another fall in the dairy prices.
• Today’s highlights: During the European day, the German ZEW survey for November is coming out. The current situation index is expected to see a modest decline, while the expectations index is expected to have risen to 5.5 from 1.9. Last month, the expectations index plunged to 1.9 from 12.1 as the Volkswagen (DE:VOWG) scandal coupled with the weak growth in EM deteriorated the economic outlook for Germany. Therefore, a rebound in expectations seems normal after such a plunge. In my view, even if the common currency reacts positively on these data, I would expect any rebounds to remain short-lived and I would treat them as renewed selling opportunities.
• From Norway, we get the GDP data for Q3. The forecast is for Norway’s GDP to have risen 0.2% qoq, a turnaround from -0.1% yoy the previous quarter. This, alongside the acceleration in the country’s inflation rate towards the target of its central bank, gives space to Norges Bank to remain on hold again at its policy meeting next month. However, the renewed slump in oil prices and expectations of a slowdown in the mainland GDP dragged by lower investments in the oil sector, NOK is poised to underperform its US counterpart, in our view. As a result, we would treat any near-term NOK strength following the GDP data as providing renewed selling opportunities.
• In the UK, the spotlight will be on the CPI data for October. The headline figure is expected to have fallen 0.1% yoy, at the same pace as in September, while the core rate is expected to have stayed at 1.0% yoy. In its quarterly inflation Report, the Bank downgraded its medium-term growth and inflation forecasts, while it noted that it sees risks slightly to the downside for inflation to reach their target in two years. As a result, a disappointment in the CPI data is possible, something that could push further back expectations of a rate hike by the BoE, and is likely to put the pound under renewed selling pressure.
• From the US, besides the CPI data for October, we get the industrial production for the same month. It is expected to have risen a bit, a turnaround from September. The NAHB housing market index for November is also to be released.
• We have three speakers scheduled on Tuesday. ECB Executive Board member Sabine Lautenschlager, Fed Governor Jerome Powell and Norges Bank Governor Oystein Olsen.
The Market
EUR/USD breaks below 1.0685
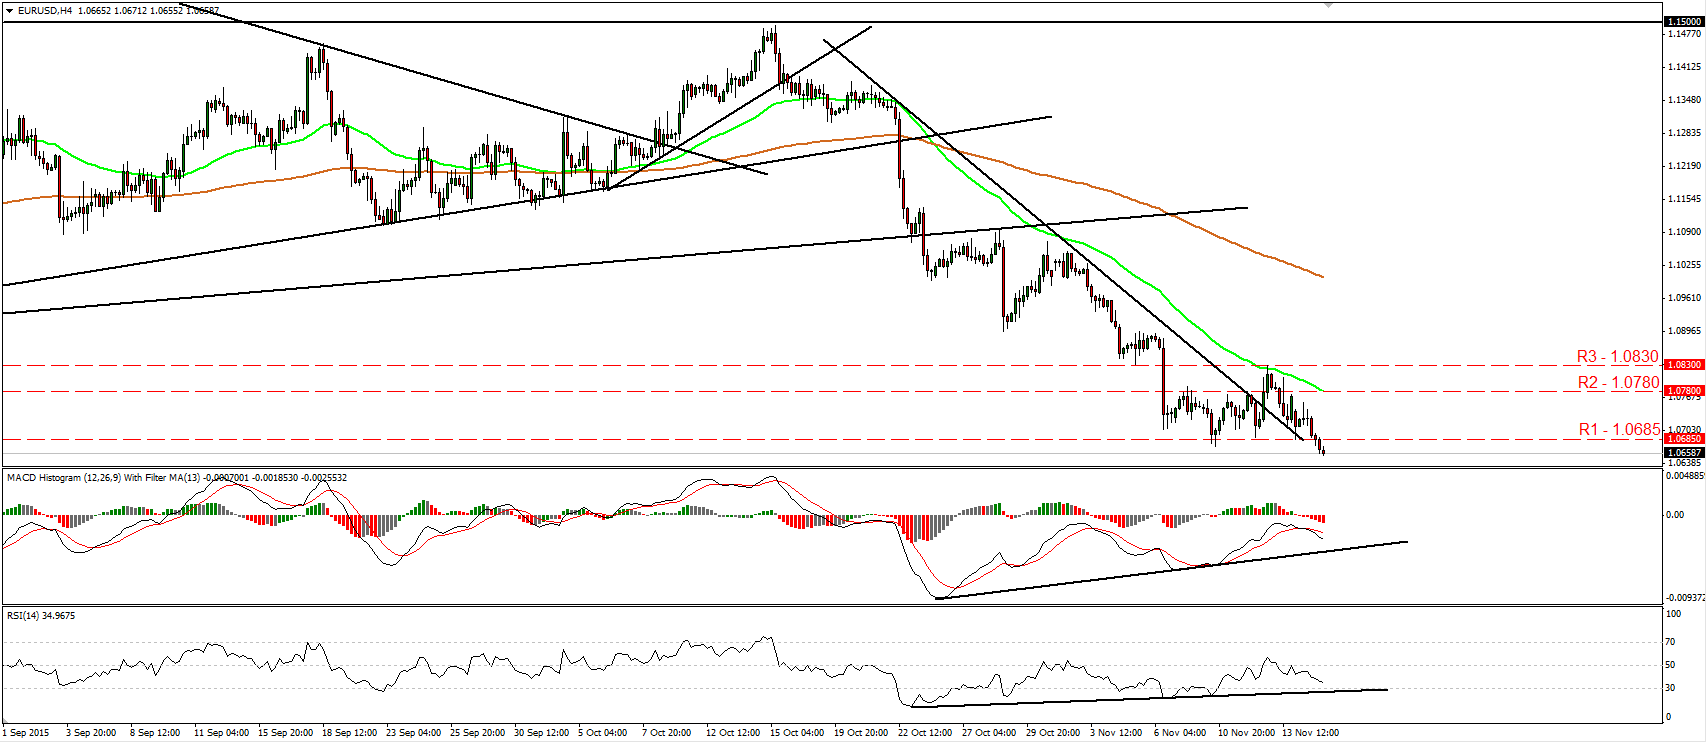
• EUR/USD traded lower yesterday, breaking below the support (now turned into resistance) barrier of 1.0685 (R1). This confirms a forthcoming lower low on the 4-hour chart and keeps the short-term outlook negative. I would now expect the bears to drive the battle lower, perhaps for a test at our next support barrier of 1.0625 (S1), defined by the low of the 16th of April. Our short-term oscillators detect negative momentum and corroborate my view. The RSI edged down after falling below its 50 line, while the MACD, already negative, has topped and fallen below its trigger line. In the bigger picture, as long as the pair is trading below 1.0800, the lower bound of the range it had been trading since the last days of April, I would consider that the longer-term outlook has turned negative and that EUR/USD could continue trading south in the foreseeable future. • Support: 1.0625 (S1), 1.0570 (S2), 1.0500 (S3) • Resistance: 1.0685 (R1), 1.0780 (R2), 1.0830 (R3)
GBP/USD tests the 1.5175 line ahead of the UK CPI data
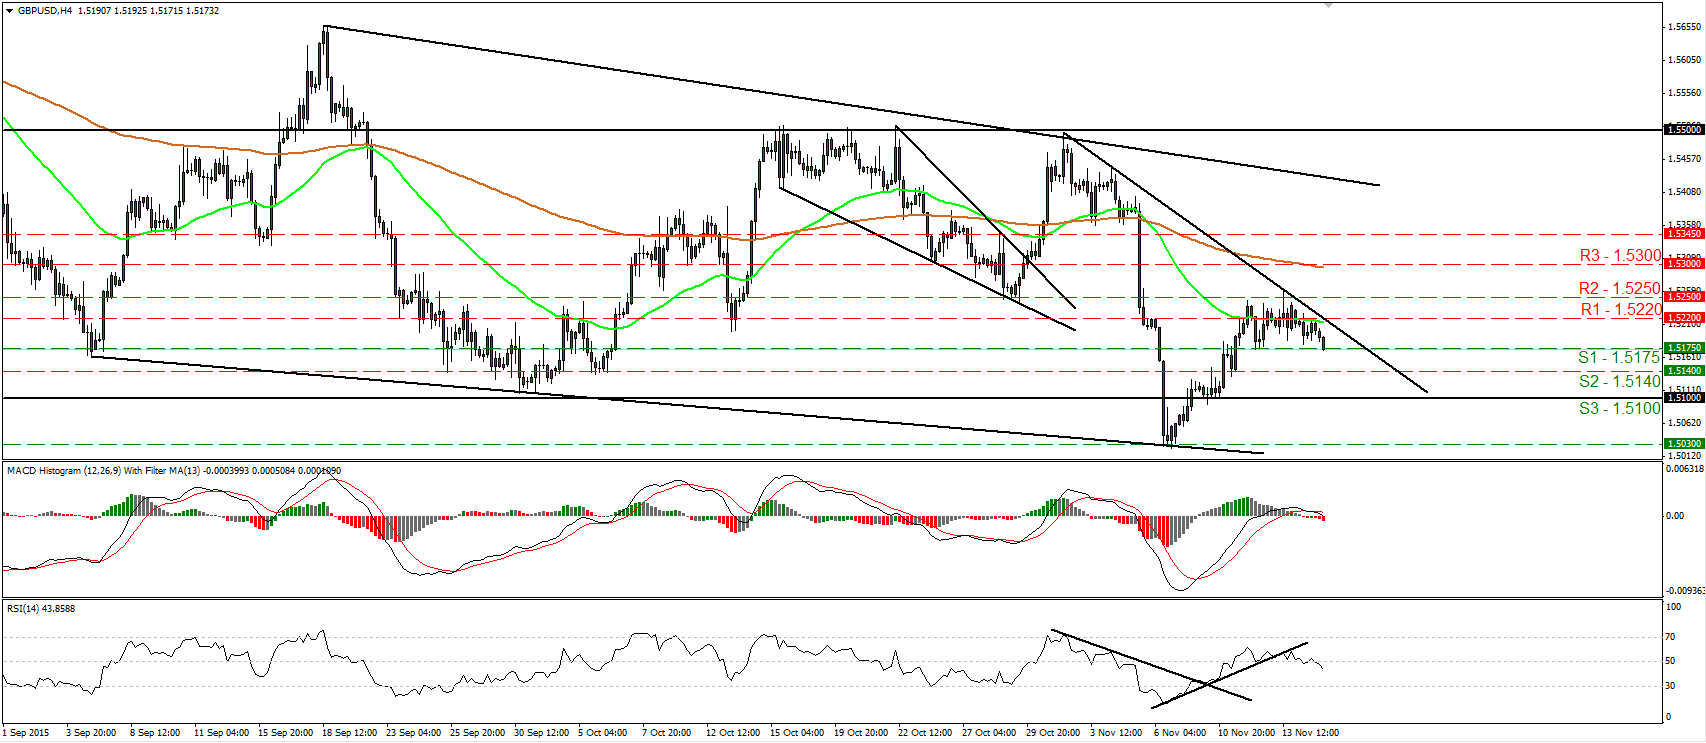
• GBP/USD traded lower yesterday after it found resistance at 1.5220 (R1). Today during the early European morning, the pair is testing the 1.5175 (S1) support zone, where a clear dip is likely to carry more bearish extensions, perhaps towards the 1.5140 (S2) zone. Today, we get the UK CPI data for October, where the headline inflation rate is forecast to have remained within the negative field, at -0.1% yoy. This could be the catalyst for a break below 1.5175 (S1). Our short-term momentum indicators detect negative momentum and support the notion. The RSI has turned down and fell below its 50 line, while the MACD has topped and fallen below its trigger line. It could turn negative soon. Switching to the daily chart, I see that the rate is trading well below the 80-day exponential moving average, which has started turning down. Therefore, I still see a cautiously negative longer-term picture and I would treat the 9th – 14th of November recovery as a corrective phase. • Support: 1.5175 (S1), 1.5140 (S2), 1.5100 (S3) • Resistance: 1.5220 (R1), 1.5250 (R2), 1.5300 (R3)
AUD/USD falls below the 0.7100 zone
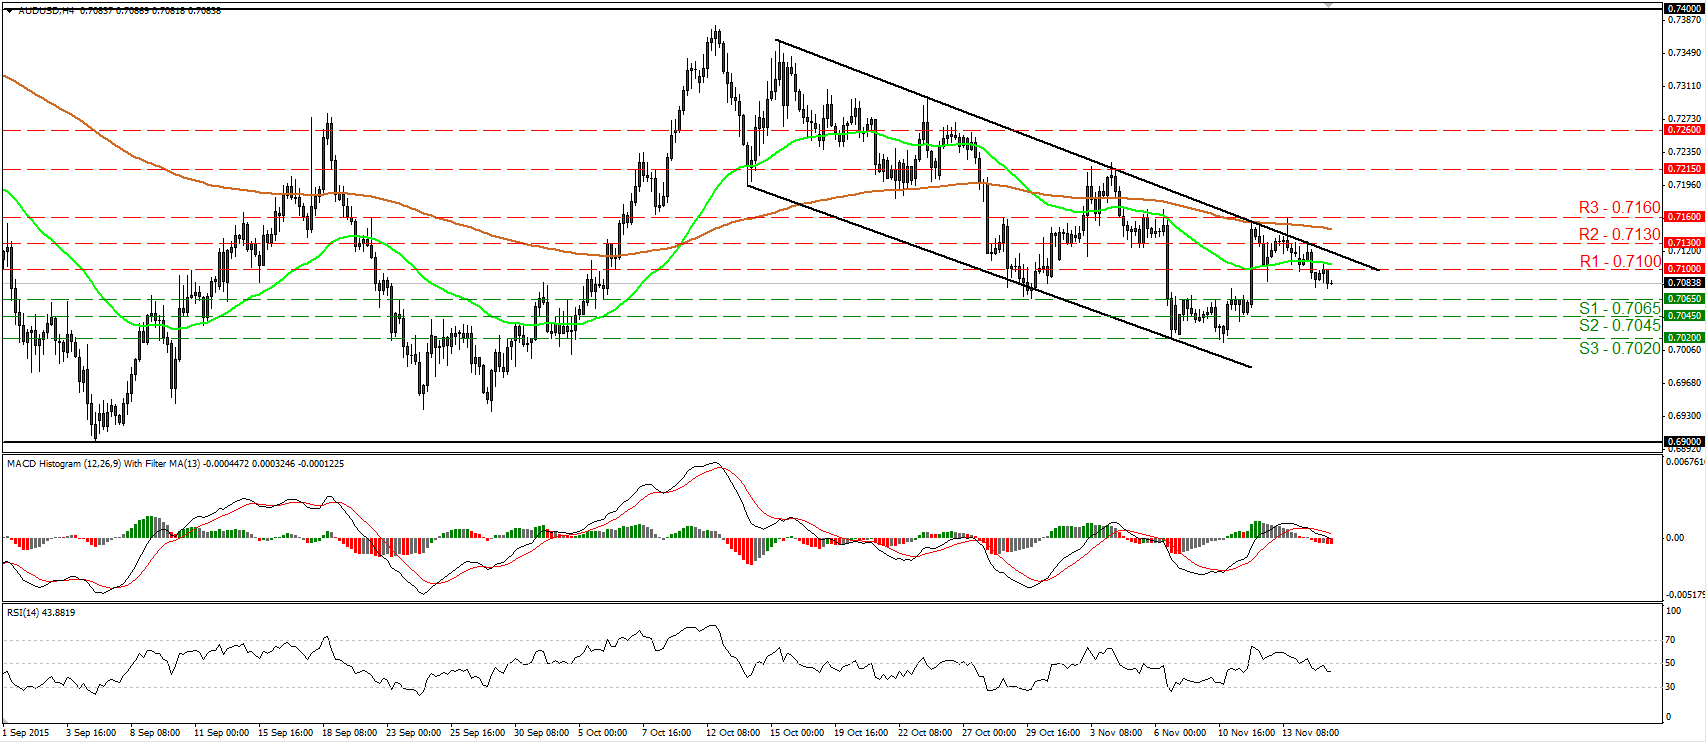
• AUD/USD traded lower on Monday, falling below the key support (now turned into resistance) obstacle of 0.7100 (R1). Today, during the early European morning, the rate looks to be headed towards the 0.7065 (S1) support line, where a clear break is possible to initially aim for the 0.7045 (S2) barrier. Another break below 0.7045 (S2) could extend the bearish wave perhaps towards the 0.7020 (S3) zone, defined by the lows of the 6th and 10th of November. As long as the rate remains within the downside channel that has been containing the price action since the 14th of October, I believe that the near-term outlook remains negative. This supports my view that AUD/USD is likely to continue trading lower in the short-run. Our short-term oscillators reveal negative momentum and corroborate my view. The RSI fell below its 50 line, while the MACD has topped, fell below its trigger line, and has just turned negative. On the daily chart, I see that AUD/USD still oscillates between 0.6900 and 0.7400 since mid-July. As a result, I would hold a flat stance for now as far as the broader trend is concerned. • Support: 0.7065 (S1), 0.7045 (S2), 0.7020 (S3) • Resistance: 0.7100 (R1), 0.7130 (R2), 0.7160 (R3)
Gold hit resistance below 1100 and tumbles
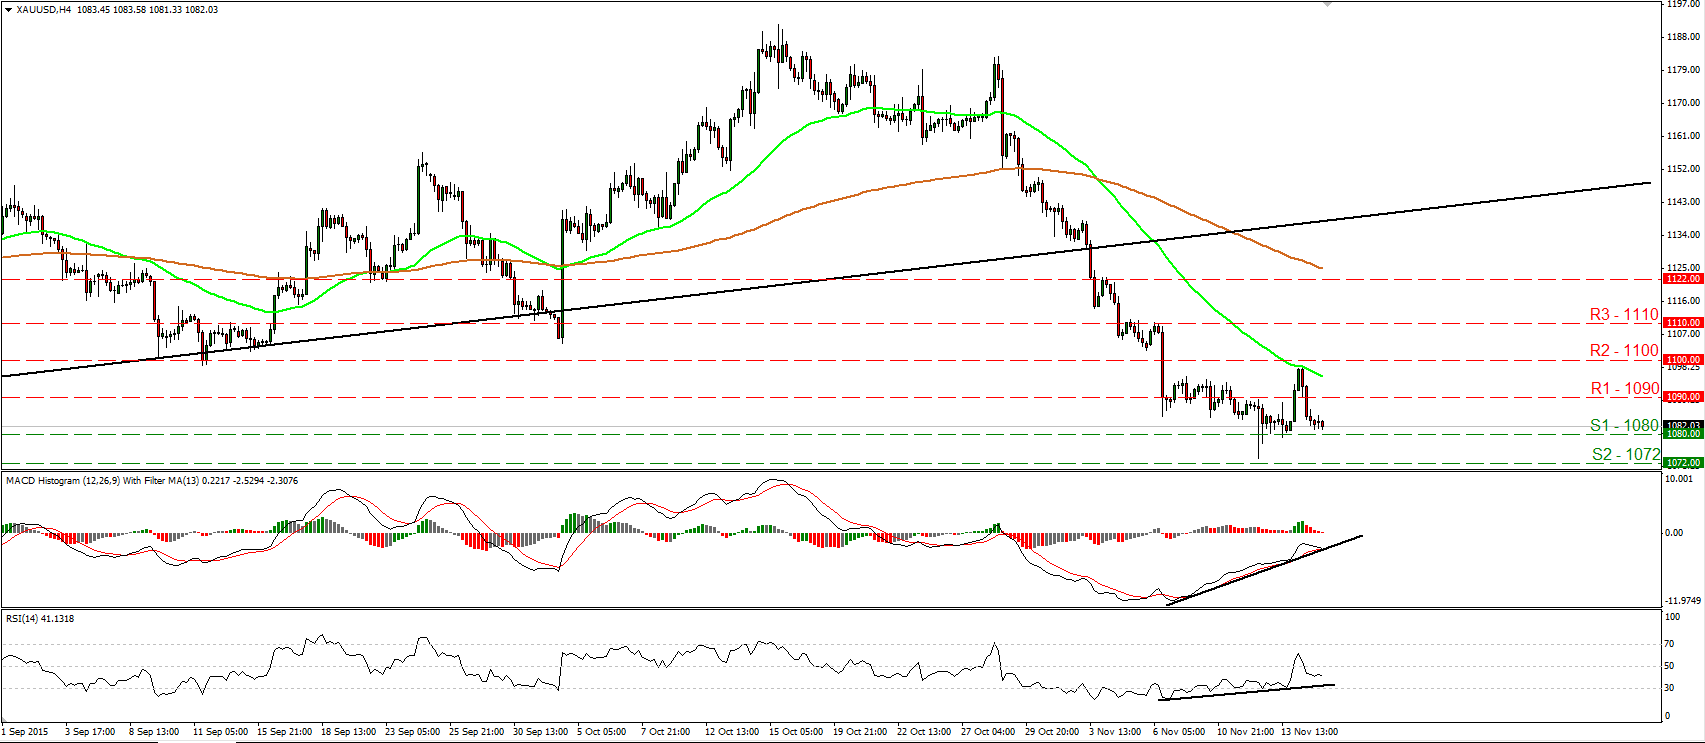
• Gold found resistance a couple of dollars below the key resistance zone of 1100 (R2) yesterday and then it tumbled to trade back below the 1090 (R1) line. The metal looks now to be headed for a test at the support barrier of 1080 (S1), where a clear dip is likely to pull the trigger for another test near the 1072 (S2) line. Taking a look at our momentum studies, I see that the RSI is back below 50, while the MACD, already negative, has topped and looks able to fall below both its trigger and upside support lines. These momentum signs add to my view that the metal could continue below 1080 (S1). On the daily chart, I see that the plunge below the upside support line taken from the low of the 20th of July has shifted the medium-term outlook to the downside. As a result, I believe that the metal is poised to continue its down road in the foreseeable future. • Support: 1080 (S1), 1072 (S2), 1060 (S3) • Resistance: 1090 (R1), 1100 (R2), 1110 (R3)
DAX futures surge after hitting 10500
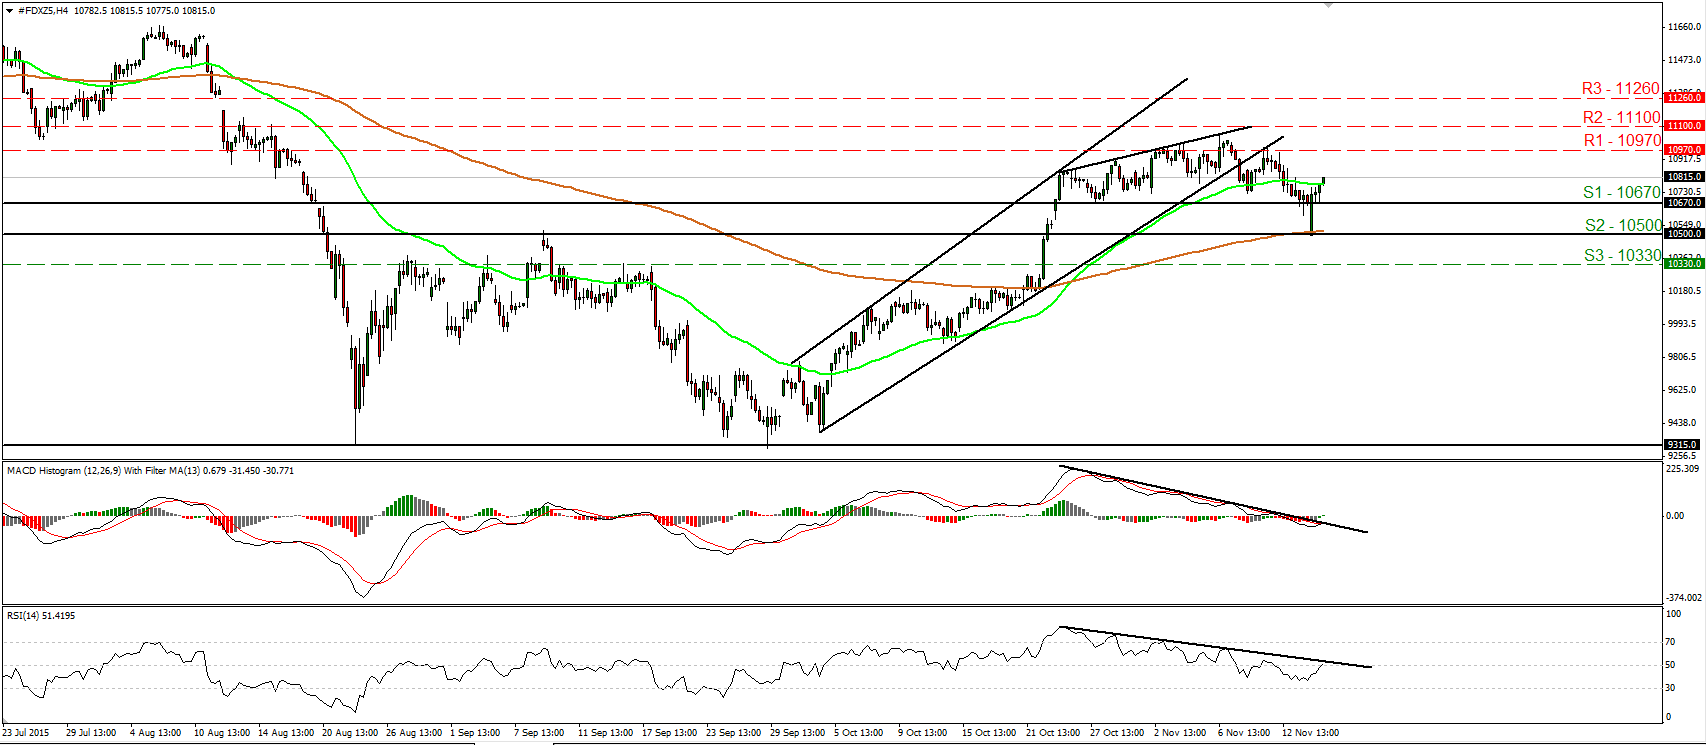
• DAX futures traded higher on Monday after it hit support at 10500 (S2). The index emerged back above the 10670 (S1) line and I believe that now is headed for another test near the 10970 (R1) zone. A break above that barrier is likely to prompt extensions towards our next resistance of 11100 (R2). Shifting my attention to our momentum studies, I see that the RSI has turned up, crossed above 50, and could now break above its downside resistance line. The MACD, although negative, has bottomed and looks able to break above both downside resistance and trigger lines. These studies amplify somewhat the case that DAX is likely to continue higher, at least in the short run. On the daily chart, the break above the psychological zone of 10500 (S2) on the 22nd of October signalled the completion of a double bottom formation. What is more, yesterday’s rebound from that psychological area adds to my view that the medium-term path remains positive and that the retreat started on the 6th of November was just a corrective phase. • Support: 10670 (S1), 10500 (S2), 10330 (S3) • Resistance: 10970 (R1), 11100 (R2), 11260 (R3)

