Dollar strengthens broadly in Asian session, followed by New Zealand Dollar and Japanese yen. On the other hand, Australian Dollar is the weakest, followed by Canadian Dollar and the Euro. But after all, major pairs and crosses are bounded in Friday’s range. Movements are so far very limited. Weakness is seen in Asian markets in general. At the time of writing, Nikkei is down -1.26%, Shanghai SSE (LON:SSE) is down -1.13%, Singapore Strait Times is down -0.65%. WTI crude oil pares some recent gains but stays firm above 73. Gold continues to hover around 1250 and last week’s low at 1246 looks vulnerable.
The upcoming week is very eventful, starting today. It’s particular important for Sterling, Canadian Dollar and Australian Dollar with important data and RBA meeting featured. Technically, despite last week’s retreat, Dollar is staying near term bullish in general. Main focus will be on 1.1507 support in EUR/USD, 1.0348 in GBP/USD and 0.7328 in AUD/USD. We’re expecting downside breakout in these pairs sooner or later. USD/CAD is a tricky one due to BoC rate outlook, but we’ll stay bullish as long as 1.3067 support holds.
EU warned auto tariffs could cost USD13-14B in US GDP
According to a report by POLITICO, European Commission sent a 11-page document to the US Commerce Department’s Bureau of Industry and Security on Friday. It warned that tariffs on European cars will be “harmful first and foremost for the US economy.” And, the impact of such tariffs on US GDP would be “in the order of 13-14 billion USD.” Additionally, the “current account balance of the US would be not affected positively.”
The document also pointed out that European carmakers contributed to production of 2.9m cars in 2017, around 26% of US production. And, production of EU-owned American car companies amounts to 16% of national production, or 1.8m vehicles. In addition to that, “EU companies based in the US export a significant part of their production, thus contributing substantially to improving the US trade balance, which is a priority of the administration.”
Also, “around 60 percent of automobiles produced in the US by companies with exclusive EU ownership are exported to third countries, including the EU. Measures harming these companies would be self-defeating and would weaken the US economy.”
Trump said EU is as bad as China, just smaller
Trump continued his attack on the EU as hie told Fox News on Sunday that “The EU is possibly as bad as China, just smaller, okay. It’s terrible what they do to us.” He added that “take a look at the car situation, they send their Mercedes in, we can’t send our cars in. And, “look what they do to our farmers, they don’t want our farm products. In all fairness they have their farmers so they want to protect their farmers. But we don’t protect ours and they protect theirs.” He also noted that “they made, last year, $151bn in trade surplus. We had a deficit with the EU.” And, “on top of that, we spend a fortune on NATO to protect them.” Trump also confirmed he will sanction European companies if they do business with Iran, in spite of requests for exemption from EU.
Separately, US ambassador to Estonia James D. Melville Jr. said in his own private facebook post that he’s retiring earlier due to Trump’s behavior and comments. That came less that two weeks ahead of NATO summit in Brussels on July 11, 12. Melville wrote in the post that “A Foreign Service Officer’s DNA is programmed to support policy and we’re schooled right from the start, that if there ever comes a point where one can no longer do so, particularly if one is in a position of leadership, the honorable course is to resign. Having served under six presidents and 11 secretaries of state, I never really thought it would reach that point for me.” And, “For the President to say the EU was ‘set up to take advantage of the United States, to attack our piggy bank,’ or that ‘NATO is as bad as NAFTA’ is not only factually wrong, but proves to me that it’s time to go.”
Japan Tankan: Large manufacturing sentiments deteriorated for another quarter
The BoJ’s quarterly Tankan survey showed notable worsening in manufacturer’s sentiments in Q2. The Larger Manufacturing Index dropped to 21, down from 24 and missed expectation of 23. It’s also a second straight quarterly decline from Q4’s 26, the first time since 2012. Large Manufacturer outlook rose to 21, up from 20. Large Non-Manufacturing index rose to 24, up from 23, beat expectation of 23. Large Non-Manufacturing Outlook rose to 21, up from 20 but missed expectation of 22. Large all industry capex rose 13.6%, beat expectation of 0.2%.
Japan PMI manufacturing revised down to 53.0
Japan PMI manufacturing was finalized at 53.0 in June, revised down from 53.1. Joe Hayes, Economist at IHS Markit noted that “Japan manufacturing PMI data continue to signal that the sector’s current expansion phase still has legs. Output growth edged up in June, supported by further inflows of new work and an accelerated rate of employment growth.” However, “concerns do remain however, as new order growth eased to a ten-month low and export sales decreased for the first time since August 2016. Moreover, with input price inflation jumping to a three-and-a-half year high, manufacturers may be forced to absorb higher cost burdens in order to remain competitive, particularly if the yen faces further safe haven demand.”
China Caxin PMI manufacturing dropped to 51.0, deteriorating exports and weak employment
China Caxin PMI manufacturing dropped 0.1 to 51.0 in June, met expectations. Dr. Zhengsheng Zhong, Director of Macroeconomic Analysis at CEBM Group said in the release that “index for new export orders fell to a low for the year so far and remained in contraction territory, pointing to a grim export situation amid escalating trade disputes between China and the U.S., which led to weak demand across the manufacturing sector.” Also, “employment index dropped for the second consecutive month, indicating worsening layoffs.” “Overall, the manufacturing PMI survey pointed to strengthening price pressures in June. Deteriorating exports and weak employment, along with companies’ destocking and poor capital turnover, put pressure on the manufacturing sector.”
Released over the weekend, the official China PMI manufacturing dropped -0.4 to 51.5 in June. Official PMI non-manufacturing rose 0.1 to 55.0.
New Zealand Treasury: Consumption and business confidence pose downside risks to growth
New Zealand Treasury’s Monthly Economic Data report noted that the 0.5% real GDP growth in Q1 was below the forecast set in the Budget Economic and Fiscal Update (BEFU). Terms of trade fell by -6.7% due to a slight fall in export prices and an increase in import prices, contributing to -0.4% decline in nominal GDP. Consumption indicators were soft. Business confidence deteriorated further in June, hitting post-election lows. Combined they suggest “there is a little less momentum in the economy and poses some downside risk to our BEFU GDP forecast in the near-term.” The report also warned that “risks around trade continue to escalate with tariffs affecting a range of trade between the US and China, and a growing number of other countries.”
IMF: USD share of global reserves hit 4-year low in Q1
Accord to latest released IMF Currency Composition of Official Foreign Exchange Reserves data, total global foreign exchange reserves rose 6.3% yoy, or by USD 878B, to USD 11.59T in Q1. Reserves held in USD rose to USD 6.499T, 62.48% of total allocated reserves. That compared to 62.72% back in Q4 2017, and hit a fresh four year low. Reserves held in EUR rose to USD 2.121T, 20.39% of total, up from Q4’s 20.15%, hitting the highest since 2014. Reserves held in RMB rose to USD 0.145T, 1.39%, of total, up for a third straight quarter.
Manufacturing data as focus of today, important week for GBP, CAD and AUD
Manufacturing data will be the main focus for today. Swiss will release SVME PMI and retail sales. Eurozone will release PMI manufacturing final, PPI and unemployment rate. UK will release PMI manufacturing. US will release ISM manufacturing, and construction spending.
Looking ahead, the week is big for Sterling, Canadian Dollar and Australia Dollar. UK PMIs may show slightly retreat in business sentiments. But upside surprises there will add to the case for an August BoE hike. Canadian employment data will also be crucial for BoC policy makers regarding July rate hike. Following last week’s dovish RBNZ statement, there are speculations that RBA could follow suit. The RBA statement and retail sales will determine whether AUD/USD can hold on to 0.7328 key support. Meanwhile, US will release ISMs and non-farm payrolls this week. FOMC minutes will be a major feature too. Attention will be on how Fed officials are confidence on a total of four rate hike this year.
Here are some highlights for the week:
- Monday: Japan Tankan; China Caixin PMI manufacturing; Swiss retail sales, SVME PMI; Eurozone PMI manufacturing revision, PPI, unemployment rate; UK PMI manufacturing; US ISM manufacturing, construction spending
- Tuesday: Japan monetary base; Australia building approvals, RBA rate decision; UK construction PMI; Canada manufacturing PMI, US factory orders
- Wednesday: Australia retail sales; UK BRC shop price, PMI services ; Eurozone PMI services final.
- Thursday: German factory orders; Eurozone retail PMI; Swiss CPI; US ADP employment, ISM non-manufacturing, FOMC minutes, jobless claims;
- Friday: Japan average cash earnings, household spending, leading indicators; German industrial production; Swiss foreign currency reserves; Canada employment, trade balance, Ivey PMI; US employment, trade balance
AUD/USD Daily Outlook
Daily Pivots: (S1) 0.7358; (P) 0.7384; (R1) 0.7433
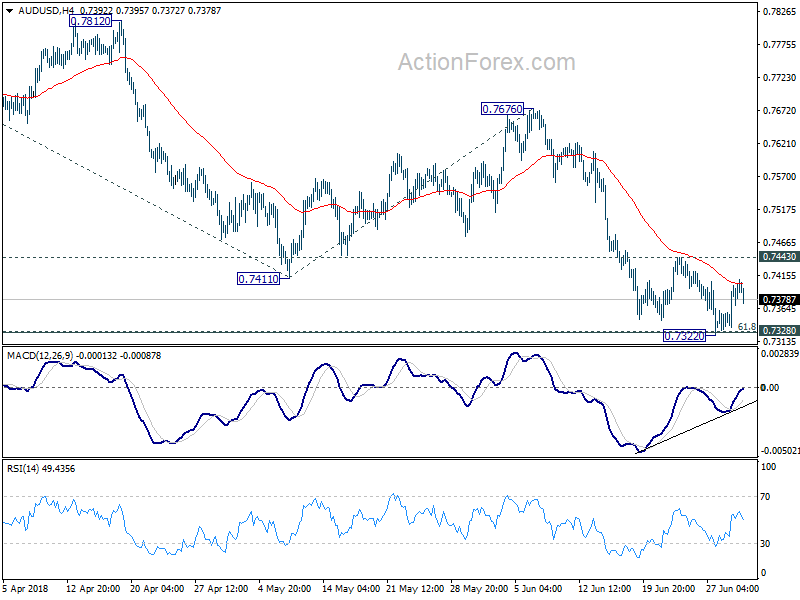
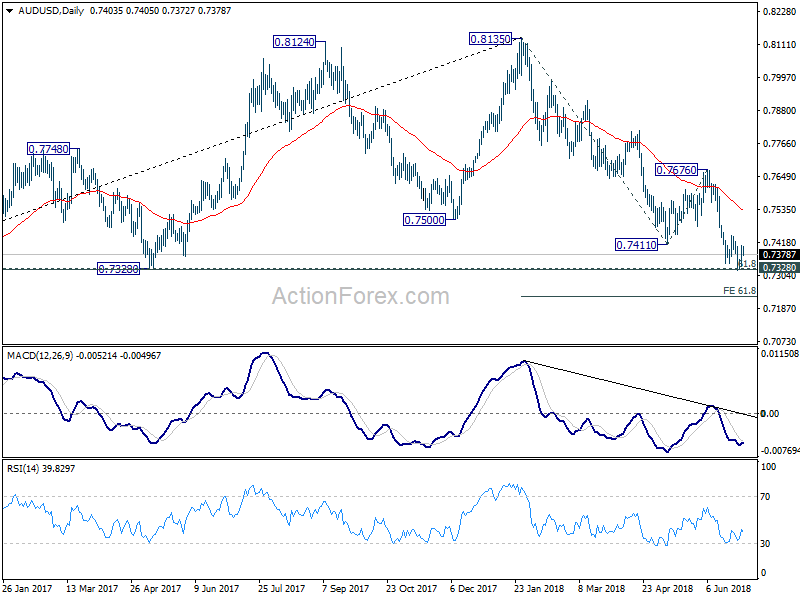
AUD/USD faced some resistance from 4 hour 55 EMA and retreats. But it’s staying in range of 0.7322/7443 and intraday bias remains neutral. As noted before, as long as 0.7443 resistance holds, further decline is expected. Sustained break of 0.7328 cluster support (61.8% retracement of 0.6826 to 0.8135 at 0.7326) will target 61.8% projection of 0.8135 to 0.7411 from 0.7676 at 0.7229 next. Though, break of 0.7443 resistance will suggest short term bottoming and bring stronger rebound back towards 0.7676 resistance.
In the bigger picture, medium term rebound from 0.6826 is seen as a corrective move that should be completed at 0.8135. Deeper decline would be seen back to retest 0.6826 low. This will now remain the favored case as long as 0.7676 resistance holds.


