
Shares of Dollar General Corporation (NYSE:DG) are down roughly 7% during the pre-market trading hours, following the company’s fourth-quarter fiscal 2018 results, wherein the bottom line fell short of the Zacks Consensus Estimate. Also, this Goodlettsville, TN-based company provided soft earnings view for fiscal 2019.
Management now envisions fiscal 2019 earnings in the band of $6.30-$6.50 per share, which is below the current Zacks Consensus Estimate of $6.66. However, the company’s projection is above fiscal 2018 reported earnings of $5.97 per share.
The company’s top line came ahead of the consensus mark. Moreover, both sales and earnings per share improved year over year. The company also witnessed sturdy same-store sales performance buoyed by both consumable and non-consumable product sales. Moreover, management highlighted about its plan to launch two transformational strategic initiatives — DG Fresh and Fast Track.
Notably, in the past six months, shares of this Zacks Rank #3 (Hold) company have advanced about 13%, against the industry’s decline of 0.4%.
Dollar General Corporation Price, Consensus and EPS Surprise
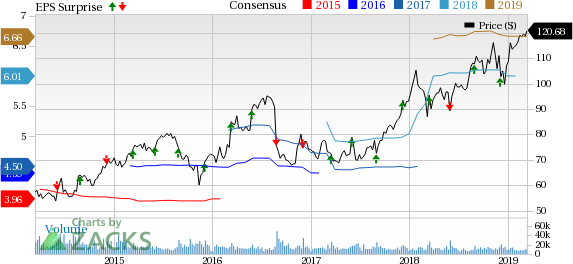
Dollar General Corporation Price, Consensus and EPS Surprise | Dollar General Corporation Quote
Let’s Delve Deep
The quarterly earnings came in at $1.84 per share that missed the Zacks Consensus Estimate of $1.88 but increased 24.3% from the prior-year period. The year-over-year increase in the bottom line can be attributed to higher net sales, cost containment efforts, lower federal tax rate and share repurchase activity.
Net sales of $6,649.8 million improved 8.5% from the prior-year period and came ahead of the Zacks Consensus Estimate of $6,602.6 million for the third quarter in row. Contribution from new outlets and comparable-store sales growth favorably impacted the top line.
Dollar General’s same-store sales increased 4% year over year primarily owing to rise in average transaction amount and customer traffic. Consumables, Seasonal and Home categories favorably impacted the metric, while Apparel category had a negative impact on the same.
Sales in the Consumables category increased 9% to $5,045.8 million, while the same in Seasonal category witnessed a rise of 7.2% to $879.1 million. Home Products sales rose 10.4% to $434.4 million, while Apparel category sales grew 1.5% to $290.5 million.
Gross profit advanced 5.4% to $2,071.7 million, however, gross margin contracted 91 basis points (bps) to 31.2% owing to sales of products carrying lower margin, increased markdowns and lower initial markups on inventory purchases. A higher proportion of sales came from Consumables. These were partly offset by an improved rate of inventory shrink. Meanwhile, operating income rose 2.4% to $638.5 million, however, operating margin shriveled 57 basis points to 9.6%.
Store Update
During fiscal 2018, Dollar General opened 900 new stores, remodeled 1,050 stores and relocated 115 stores. The company ended the period with 15,370 stores. During fiscal 2019, the company plans to open about 975 new stores, remodel 1,000 stores and relocate 100 stores.
Other Financial Details
Dollar General ended the quarter with cash and cash equivalents of $235.5 million, long-term obligations of $2,862.7 million and shareholders’ equity of $6,417.4 million. The company incurred capital expenditures of $734 million during fiscal 2018. For fiscal 2019, it now anticipates capital expenditures in the range of $775-$825 million.
The company bought back 9.9 million shares for $1 billion during fiscal 2018. At the end of the fiscal year, it has an outstanding authorization of nearly $346 million. The company’s board of directors increased the share buyback authorization by $1 billion and also raised the quarterly dividend by 10% to 32 cents a share.
Outlook
Management now expects fiscal 2019 net sales to increase about 7% with same-store sales growth of approximately 2.5%. The company now envisions operating profit growth of approximately 4-6%.
3 Hot Stocks Awaiting Your Look
Costco (NASDAQ:COST) delivered an average positive earnings surprise of 5.5% in the trailing four quarters. It carries a Zacks Rank #2 (Buy). You can see the complete list of today’s Zacks #1 Rank (Strong Buy) stocks here.
Target (NYSE:TGT) has a long-term earnings growth rate of 6.3% and a Zacks Rank #2.
Walmart (NYSE:WMT) delivered an average positive earnings surprise of 5.1% in the trailing four quarters and carries a Zacks Rank #2.
Today's Best Stocks from Zacks
Would you like to see the updated picks from our best market-beating strategies? From 2017 through 2018, while the S&P 500 gained +15.8%, five of our screens returned +38.0%, +61.3%, +61.6%, +68.1%, and +98.3%.
This outperformance has not just been a recent phenomenon. From 2000 – 2018, while the S&P averaged +4.8% per year, our top strategies averaged up to +56.2% per year.
See their latest picks free >>
Target Corporation (TGT): Free Stock Analysis Report
Dollar General Corporation (DG): Free Stock Analysis Report
Walmart Inc. (WMT): Free Stock Analysis Report
Costco Wholesale Corporation (COST): Free Stock Analysis Report
Original post