Do you feel lucky? That was the topic of this past weekend's missive as we wrote extensively on the current market environment and the technical setup behind the recent market "buy" signal. That line from Dirty Harry spawned many email questions, and comments, over the weekend primarily revolving around the central question of "why now?" The market has rallied for two months straight - so why would buy signals be triggered now? It is a great question and deserves a great answer. Unfortunately, I don't have one.
As we discussed, the underlying fundamental analysis does not support either the recent rally or a further rally to new highs. The same goes for the economic data which continues to be weak, and while there may intermitent "pops" in the data due to seasonal adjustments, weather anomalies, etc., the current trend is negative and signals further deterioration for now. However, economic and fundamental analysis are very poor short-term portfolio management tools. This is why we use technical analysis, based on weekly data, to manage portfolio risk in the short-term so that we can safely maintain a long term fundamental and economic view on overall asset allocation.
Sometimes, however, things do not go according to plan. As we stated this past weekend:
In April we began discussing reducing exposure as sell signals begin to occur within our intermediate and longer term indicators. Then, during the very sharp May decline, we suggested that investors not panic sell but wait on a rebound rally in June to reduce equity risk. It all occurred just as anticipated.
Then it all went haywire. During the June rally, as the economic and fundamental backdrop began to show signs of severe strain, the markets began to bet that the Fed would engage in another balance sheet expansion program (QE3) at the June FOMC meeting. We stated clearly that this would not be the case. We were right.
With the markets disappointed initially but undeterred – market analysts quickly jumped to the conclusion that the Fed would definitely announce QE3 at the August 1st meeting. Again, we clearly made the case the markets were trapping the Fed on further action – we were right.
Yet, since the Fed failed to act, market analysts have now determined that it is an absolutely certain event that the Fed will act by the September FOMC meeting. Again, we are saying that the Fed will not act.
The reason I bring this bit of history up is that the markets have been rallying for two months on "hope" of further stimulative actions by the Fed, and also the ECB, to bailout the global economy. While our event calls have been deadly accurate over the last few months – the market reaction to those events have been anything but logical. I often equate investing to poker and the management of investment risk relative to the "hand you are holding"– it is possible to lose a hand of poker holding a "full house." That doesn't mean that the risk analysis was incorrect. It just means that sometimes predictions of future events do not turn out as expected.
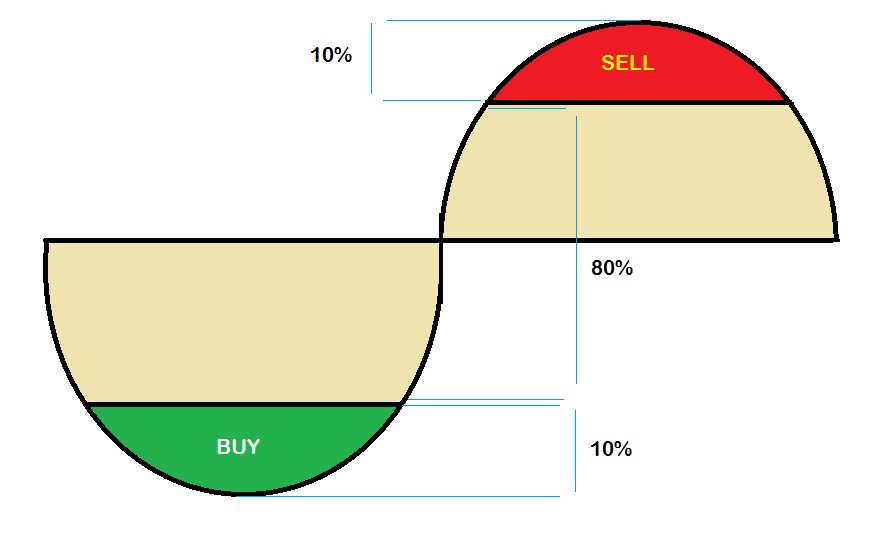
That is the nature of the market to do completely irrational things that lure investors in to buy at the tops and flush them out at the bottoms. Our goal, as money managers, is to minimize the inherent emotional biases of investing by overlaying technical analysis, which is more closely linked to market "psychology," to our fundamental and macro economic asset selection process. Our objective as money managers is to obtain 80% of the annual return of the market during advances but only 20% of the declines. This philosophy is detailed in the chart.

In order to minimize portfolio turnover in accounts we use "weekly" signals to slow down the volatility of the signals and reduce short-term "noise." I am not interested in short-term trading profits but changes in the trend of the market. Therefore, with these slower moving signals there are two inherent risks that occur in the short-term: 1) During a market bottoming process it is entirely possible to get in 10% to early or 10% to late and 2) the same applies to market topping processes. In either event we should still be in a position to capture, or miss, 80% of the market trend once it develops.
It is apparent that by using this strategy that I will never beat the market in any given year when the market advances. That is not my goal. However, that is the goal of the majority of fund managers who are paid to chase the market in any given year. The problem is that chasing an "all equity" benchmark leads to an excessive risk profile in portfolios. Investors are happy as long as the markets rise, however, when the trend reverses that excess risk is destructive to investor's retirement savings. While the 80/20 investment goal is not nearly as exciting as being able to brag to your neighbors that you "beat the market" this year - it does provide the ability to "beat your retirement goal."
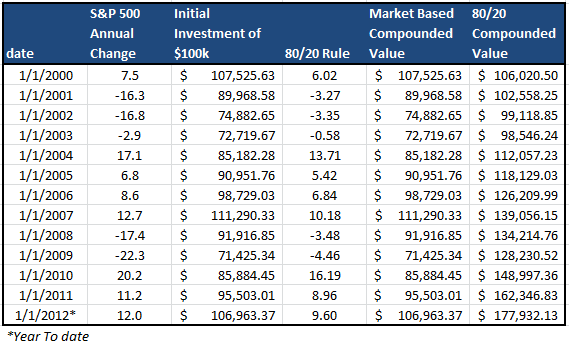
The table shows a $100,000 investment into the S&P 500 index at the beginning of the year in 2000 through the current 2012 period. The chart assumes an investment made on the 1st day of 2000 through the end of the year. Dividends are excluded for the purpose of this exercise.

The third column shows 80% of any annual advance in the S&P 500 and 20% of any annual decline. The last two columns show the compounded returns of both the S&P 500 and the 80/20 rule.
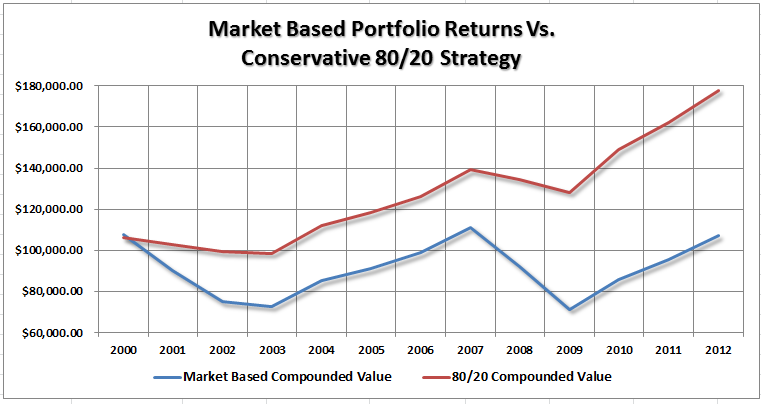
The chart shows graphically the difference in investor's portfolios over the last 12 years. Even though an investor never beat the market in any given year, the net return to his portfolio was 66% greater than chasing the benchmark index.

Buy Signals Are In!
As we stated on Friday, "Our 'buy' signals are back online but the setup is very poor on a risk/reward basis." The inherent risks of increasing exposure to the markets at current levels outweighs the possible reward. The only reason currently that "buy signals" are coming back online is the "hope" of continued Fed, and ECB, market intervention in the weeks ahead. The question no one seems to be asking is "what if it doesn't happen?" It seems to me that there is a lot of "hope" priced into the market currently.
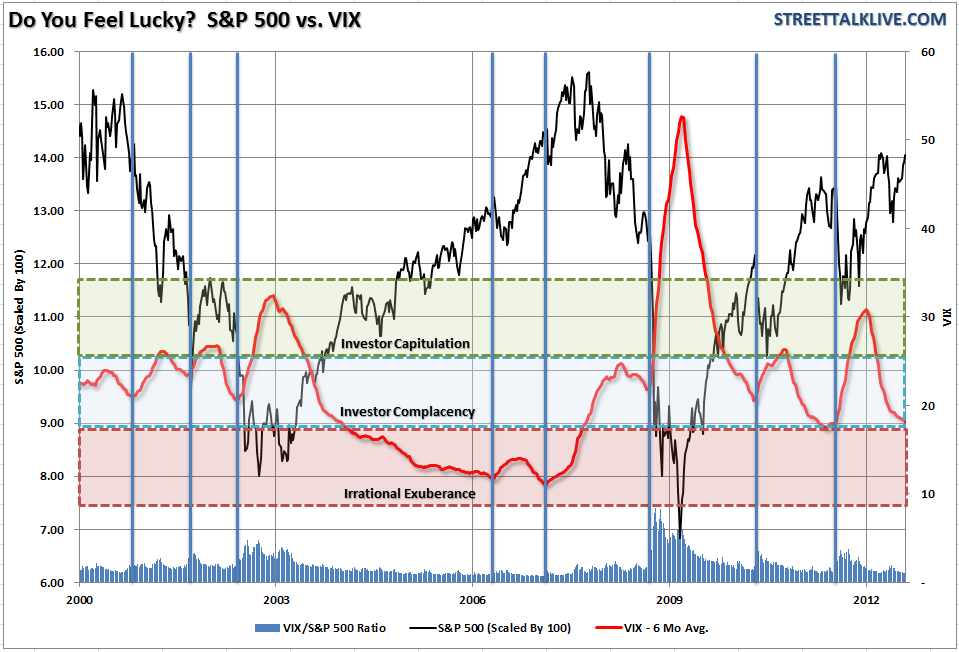
The chart shows the 6-month average of the Volatility Index (VIX) versus the S&P 500. I have scaled the S&P 500 by 100 to make the charts more legible. I have divided the VIX into three categories - irrational exuberance (seen during the late 90's and the mid-2000 credit/housing bubble), investor complacency (more normalized levels of "no fear" of a market correction) and investor capitulation (sell everything). Currently, the VIX is at levels more associated with market tops than market bottoms and is very reminiscent of the 2011 market peak. The question now is simply "Do you feel lucky?"

There are more than enough potential catalysts to create a short-term correction in the markets. That correction will allow for increases in equity exposure to portfolios at lower levels of portfolio risk. Being disciplined and patient in your investing process will lead to longer term success.
As we stated above - professional gamblers understand the risks of winning, or losing, any potential hand. Weighing that risk, and allocating capital accordingly, is what separates winners from losers. There is no difference when investing. Managing portfolio risk means that you may not catch every opportunity - but avoiding the major losses is what keeps you in the game.
As we discussed, the underlying fundamental analysis does not support either the recent rally or a further rally to new highs. The same goes for the economic data which continues to be weak, and while there may intermitent "pops" in the data due to seasonal adjustments, weather anomalies, etc., the current trend is negative and signals further deterioration for now. However, economic and fundamental analysis are very poor short-term portfolio management tools. This is why we use technical analysis, based on weekly data, to manage portfolio risk in the short-term so that we can safely maintain a long term fundamental and economic view on overall asset allocation.
Sometimes, however, things do not go according to plan. As we stated this past weekend:
In April we began discussing reducing exposure as sell signals begin to occur within our intermediate and longer term indicators. Then, during the very sharp May decline, we suggested that investors not panic sell but wait on a rebound rally in June to reduce equity risk. It all occurred just as anticipated.
Then it all went haywire. During the June rally, as the economic and fundamental backdrop began to show signs of severe strain, the markets began to bet that the Fed would engage in another balance sheet expansion program (QE3) at the June FOMC meeting. We stated clearly that this would not be the case. We were right.
With the markets disappointed initially but undeterred – market analysts quickly jumped to the conclusion that the Fed would definitely announce QE3 at the August 1st meeting. Again, we clearly made the case the markets were trapping the Fed on further action – we were right.
Yet, since the Fed failed to act, market analysts have now determined that it is an absolutely certain event that the Fed will act by the September FOMC meeting. Again, we are saying that the Fed will not act.
The reason I bring this bit of history up is that the markets have been rallying for two months on "hope" of further stimulative actions by the Fed, and also the ECB, to bailout the global economy. While our event calls have been deadly accurate over the last few months – the market reaction to those events have been anything but logical. I often equate investing to poker and the management of investment risk relative to the "hand you are holding"– it is possible to lose a hand of poker holding a "full house." That doesn't mean that the risk analysis was incorrect. It just means that sometimes predictions of future events do not turn out as expected.
That is the nature of the market to do completely irrational things that lure investors in to buy at the tops and flush them out at the bottoms. Our goal, as money managers, is to minimize the inherent emotional biases of investing by overlaying technical analysis, which is more closely linked to market "psychology," to our fundamental and macro economic asset selection process. Our objective as money managers is to obtain 80% of the annual return of the market during advances but only 20% of the declines. This philosophy is detailed in the chart.

In order to minimize portfolio turnover in accounts we use "weekly" signals to slow down the volatility of the signals and reduce short-term "noise." I am not interested in short-term trading profits but changes in the trend of the market. Therefore, with these slower moving signals there are two inherent risks that occur in the short-term: 1) During a market bottoming process it is entirely possible to get in 10% to early or 10% to late and 2) the same applies to market topping processes. In either event we should still be in a position to capture, or miss, 80% of the market trend once it develops.
It is apparent that by using this strategy that I will never beat the market in any given year when the market advances. That is not my goal. However, that is the goal of the majority of fund managers who are paid to chase the market in any given year. The problem is that chasing an "all equity" benchmark leads to an excessive risk profile in portfolios. Investors are happy as long as the markets rise, however, when the trend reverses that excess risk is destructive to investor's retirement savings. While the 80/20 investment goal is not nearly as exciting as being able to brag to your neighbors that you "beat the market" this year - it does provide the ability to "beat your retirement goal."
The table shows a $100,000 investment into the S&P 500 index at the beginning of the year in 2000 through the current 2012 period. The chart assumes an investment made on the 1st day of 2000 through the end of the year. Dividends are excluded for the purpose of this exercise.

The third column shows 80% of any annual advance in the S&P 500 and 20% of any annual decline. The last two columns show the compounded returns of both the S&P 500 and the 80/20 rule.
The chart shows graphically the difference in investor's portfolios over the last 12 years. Even though an investor never beat the market in any given year, the net return to his portfolio was 66% greater than chasing the benchmark index.

Buy Signals Are In!
As we stated on Friday, "Our 'buy' signals are back online but the setup is very poor on a risk/reward basis." The inherent risks of increasing exposure to the markets at current levels outweighs the possible reward. The only reason currently that "buy signals" are coming back online is the "hope" of continued Fed, and ECB, market intervention in the weeks ahead. The question no one seems to be asking is "what if it doesn't happen?" It seems to me that there is a lot of "hope" priced into the market currently.
The chart shows the 6-month average of the Volatility Index (VIX) versus the S&P 500. I have scaled the S&P 500 by 100 to make the charts more legible. I have divided the VIX into three categories - irrational exuberance (seen during the late 90's and the mid-2000 credit/housing bubble), investor complacency (more normalized levels of "no fear" of a market correction) and investor capitulation (sell everything). Currently, the VIX is at levels more associated with market tops than market bottoms and is very reminiscent of the 2011 market peak. The question now is simply "Do you feel lucky?"

There are more than enough potential catalysts to create a short-term correction in the markets. That correction will allow for increases in equity exposure to portfolios at lower levels of portfolio risk. Being disciplined and patient in your investing process will lead to longer term success.
As we stated above - professional gamblers understand the risks of winning, or losing, any potential hand. Weighing that risk, and allocating capital accordingly, is what separates winners from losers. There is no difference when investing. Managing portfolio risk means that you may not catch every opportunity - but avoiding the major losses is what keeps you in the game.
