💎 Fed’s first rate cut since 2020 set to trigger market. Find undervalued gems with Fair ValueSee Undervalued Stocks

DJIA: Technical Analysis

Published 07/17/2017, 08:46 AM
Updated 07/09/2023, 06:31 AM
DJI
-

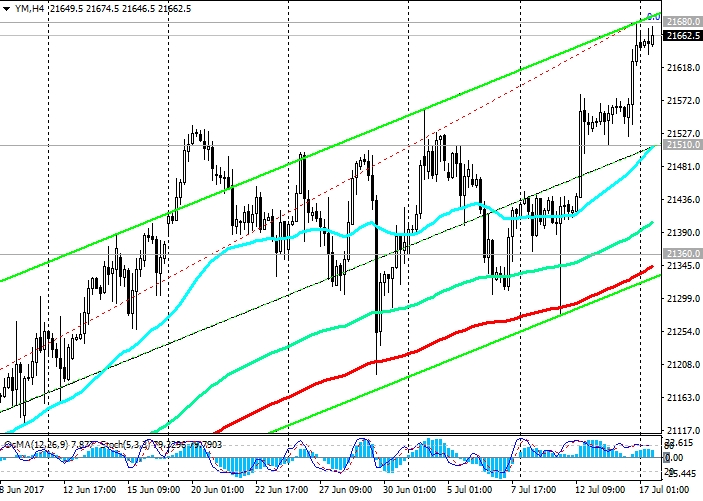
DJIA updated its annual highs on Friday and reached a new absolute maximum near the mark of 21680.0. The DJIA Index continues to grow steadily, starting from February 2016 and trading in the ascending channels on the daily and weekly charts.

So far, the index is trading above the key support level of 20300.0 (EMA200 on the daily chart, as well as the Fibonacci level of 23.6% correction to the growth in the wave from the level of 15660.0 after rebounding in February this year to the collapse of the markets since the beginning of the year. The maximum of this wave and the Fibonacci level 0% is near the mark of 21536.0), its medium-term positive dynamics is preserved. The long positions in the DJIA index trade are relevant.

Against the background of low inflation in the US and the Fed's predilection, in connection with this, to a cautious approach in the matter of further interest rate hikes, the further growth of the DJIA index is likely.

Only in case of breakdown of the support level of 21360.0 (EMA200 on the 4-hour chart) can we again return to consideration of short positions on the DJIA index. And only in case of breakdown of the support level of 19380.0 (Fibonacci level of 38.2%) can we speak about the breakdown of the bullish trend.

Support levels: 21510.0, 21360.0, 21100.0, 20600.0, 20300.0

Resistance levels: 21680.0, 22000.0

Trading Recommendations

Buy Stop 21690.0. Stop-Loss 21500.0. Take-Profit 21700.0, 21800.0, 22000.0

Sell ​​Stop 21500.0. Stop-Loss 21690.0. Take-Profit 21360.0, 21100.0, 21000.0, 20600.0

*)presented material expresses the personal views of the author and is not a direct guide to conduct trading operations.

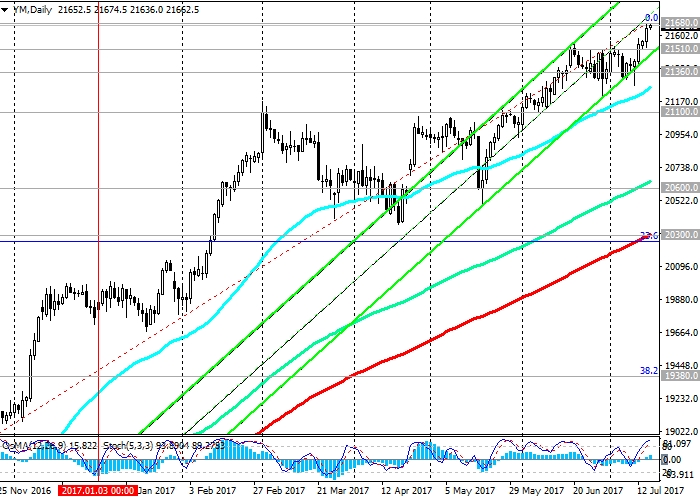
DJIA DailyDJIA 4-hour Chart

Latest comments

Loading next article…
Risk Disclosure: Trading in financial instruments and/or cryptocurrencies involves high risks including the risk of losing some, or all, of your investment amount, and may not be suitable for all investors. Prices of cryptocurrencies are extremely volatile and may be affected by external factors such as financial, regulatory or political events. Trading on margin increases the financial risks.
Before deciding to trade in financial instrument or cryptocurrencies you should be fully informed of the risks and costs associated with trading the financial markets, carefully consider your investment objectives, level of experience, and risk appetite, and seek professional advice where needed.
Fusion Media would like to remind you that the data contained in this website is not necessarily real-time nor accurate. The data and prices on the website are not necessarily provided by any market or exchange, but may be provided by market makers, and so prices may not be accurate and may differ from the actual price at any given market, meaning prices are indicative and not appropriate for trading purposes. Fusion Media and any provider of the data contained in this website will not accept liability for any loss or damage as a result of your trading, or your reliance on the information contained within this website.
It is prohibited to use, store, reproduce, display, modify, transmit or distribute the data contained in this website without the explicit prior written permission of Fusion Media and/or the data provider. All intellectual property rights are reserved by the providers and/or the exchange providing the data contained in this website.
Fusion Media may be compensated by the advertisers that appear on the website, based on your interaction with the advertisements or advertisers.
© 2007-2024 - Fusion Media Limited. All Rights Reserved.