The DJIA fell by 1175 points on Monday, marking the worst daily decline in its entire 122-year history. In percentage points, however, yesterday’s selloff was not as big as Black Monday‘s 508-point crash on October 19, 1987, but it was still big and fast enough to make some investors wonder if this is the end of the strong bull market, which has been in progress since March, 2009.
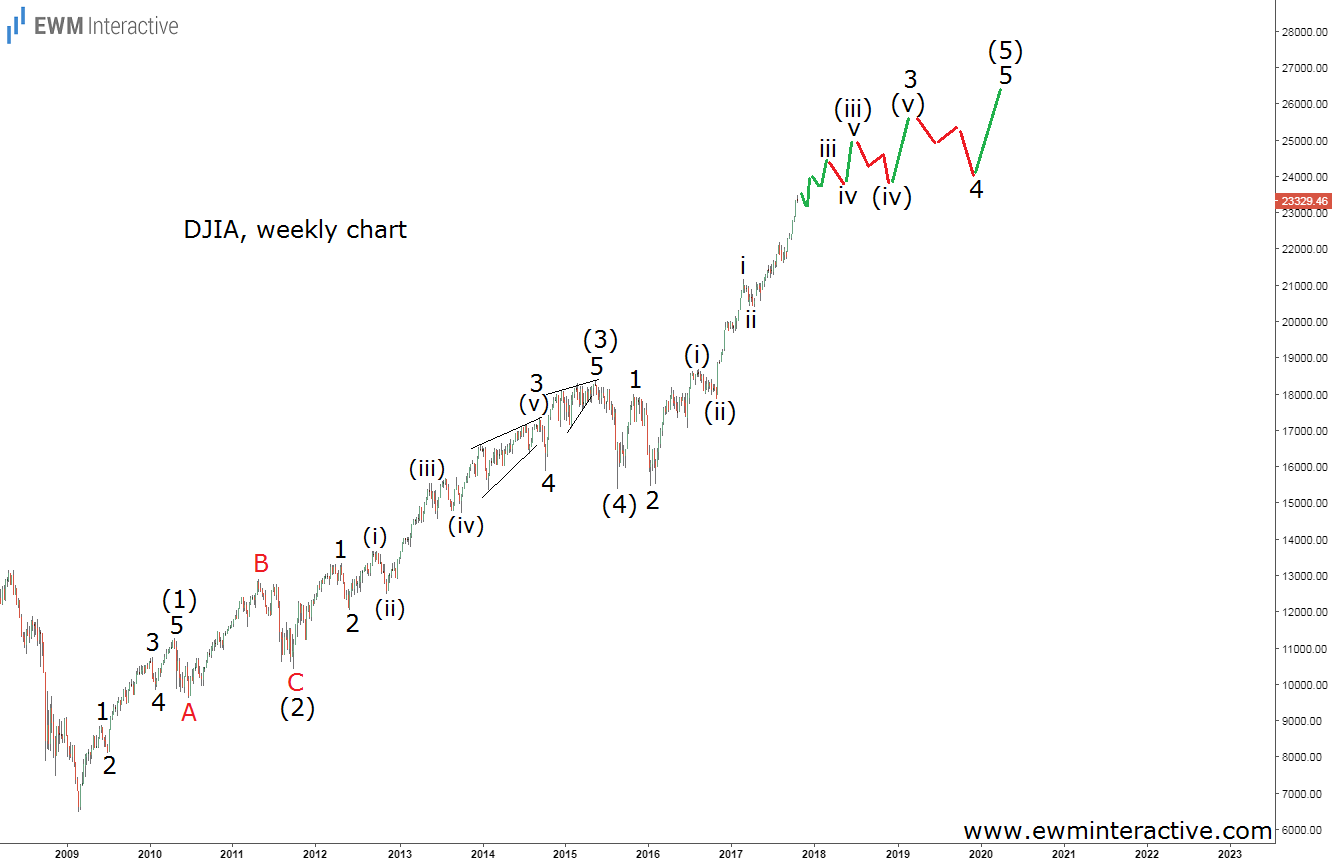
The Dow Jones Industrial Average reached an all-time high of 26 617 on January 26th and has been plunging ever since. In this article we will see if the recent weakness is a cause for concern by putting it into Elliott Wave perspective. But first, we need to see how we got here. The chart below was included in “DJIA: Extended Fifth Wave in Progress”, published on October 26th, 2017.
As visible, while Dow Jones was hovering around 23 330, the Elliott Wave Principle suggested “the 26 000 mark is there for the taking.” However, the bulls managed to get there a lot faster than we expected. Instead of losing time in a series of fourth and fifth waves, the price went straight up to 26 000 and then some. So what does yesterday’s collapse stand for? Is it the start of an even larger bear market or just a pullback within the ongoing uptrend?
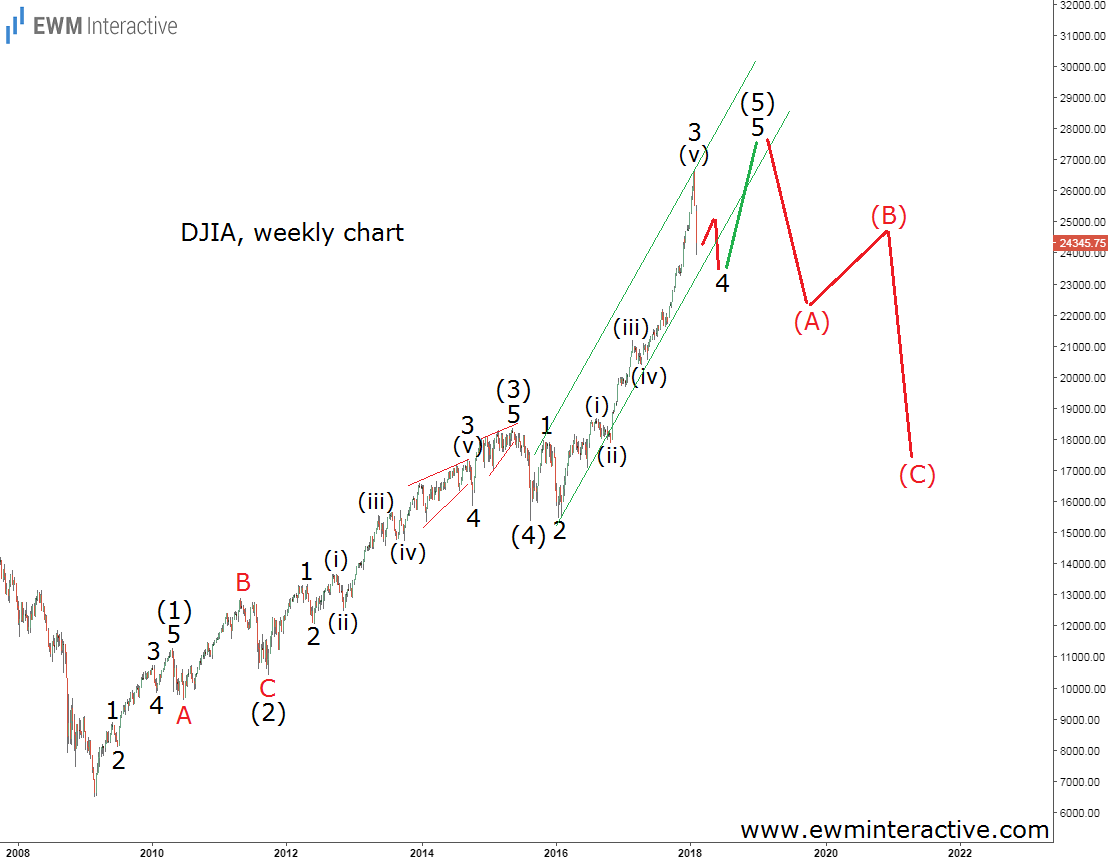
The updated weekly price chart of the DJIA supports the latter. It makes us think that 26 617 marks the end of only wave 3 of (5) of the post-2009 impulse pattern. If that is correct, the sharp decline we have been witnessing during the last ten days fits into the position of wave 4 of (5). Fourth waves usually breach the lower line of trend channels drawn through the extremes of wave one and three. If this happens here, the index could be expected to find support somewhere near the 23 000 mark and reverse to upside for one last push in wave 5 of (5).
To sum things up, it seems to be too early to panic. The recent price drop, although a sharp one, appears to be nothing more than another dip within the larger bull market. The DJIA might even revisit 23 000, but targets near 27 000 remain plausible. It is around 27k where we should get really worried though, because the entire impulse since the bottom in 2009 would be complete and the theory states that a three-wave correction of the same degree should follow.
