Crazy price action this past week. Yeesh! The last couple of weeks of trade have price right back where it started. Is it going to break out? Continue to chop? Fall apart? The S&P 500 is right back at resistance and starts a new quarter on Tuesday.
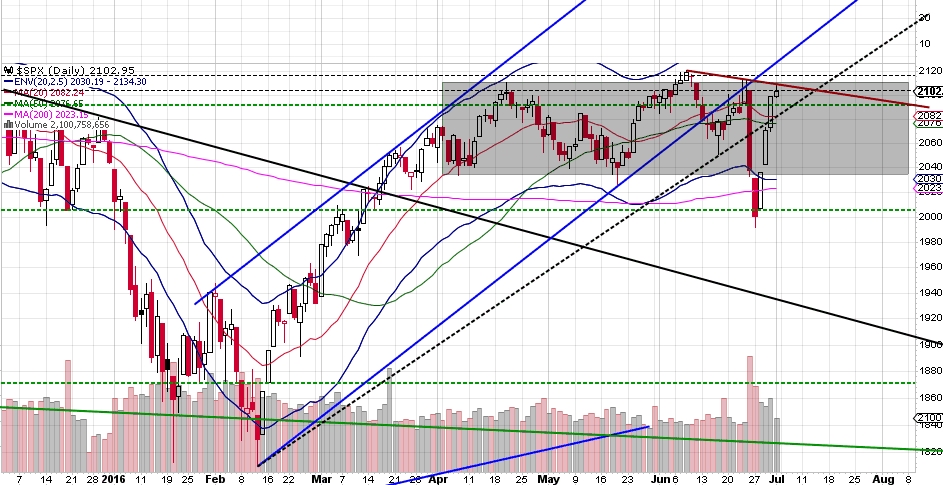
One thing to note is that the SKEW has come back in from projecting a higher likelihood of a more than 2 standard deviation move below the mean.

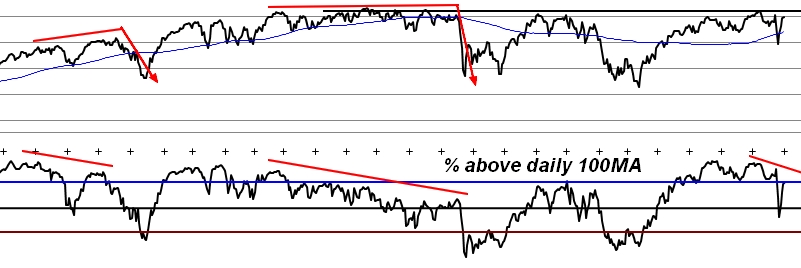
The % of stocks above their 100MA indicator—which had a huge divergence in 2015—is slightly underperforming price at the moment. It hasn’t recovered its high even though SPX is at its high again.
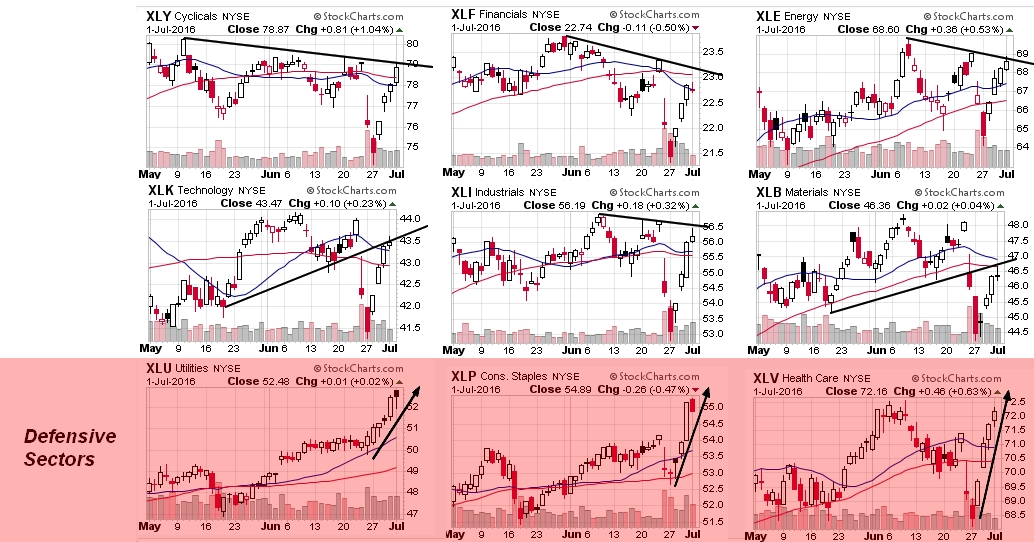
What are the sectors telling us? Interestingly, the defensive sectors XLU, Utilities, and XLP, Consumer Staples, are the only SPDR sectors that broke out to new highs. XLV, Healthcare, is performing well too, having broken its downtrend line, but the rest of the sectors are pressed up against resistance, some still well below their highs.
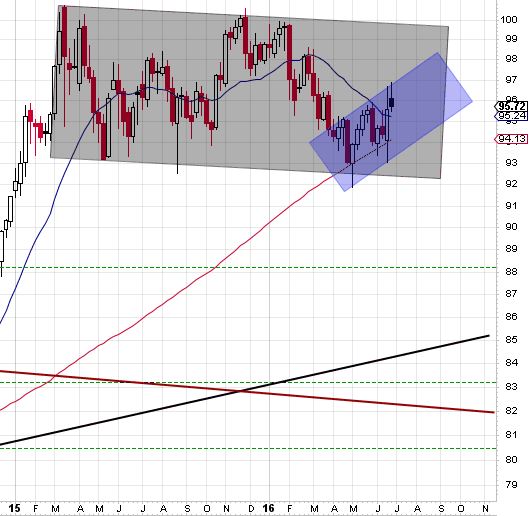
The USD appears to be a in a bear flag on the weekly chart. Either that or its established a fresh uptrending channel. It doesn’t seem likely to break down because that would also send the euro up which doesn’t seem likely among all the uncertainty regarding its future. That said, the USD is at its high point and looks ready to flatten or turn down towards the bottom of its channel again.
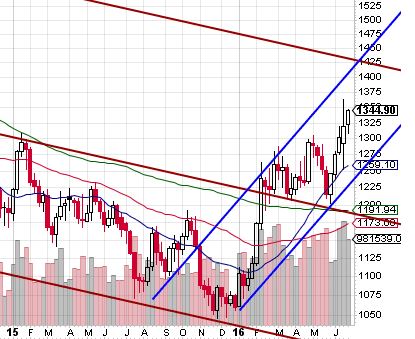
Gold had a great week again within its uptrending channel. I don’t see why it shouldn’t hit the channel high at 1400+.
So that’s my chart gallery for this week.
