Another month is in the books. Stock markets around the world are at record highs. And what is the lead story I read this morning? How the bond market is signaling a recession about to happen. I might be wrong, but those that read the Bond market and translate it to the stock market (Gundlach, Gross…) have not been at the top of the game lately (I mean the last 4 years). Rather than worry about what the Bond market is telling them I will continue to focus on what the stock market is saying to me.
The stock market has its own language, price. It is not complicated to learn like learning Chinese, or understand like trying to translate what Bonds are saying. The problem is that too many investors and traders just are not listening. It like that conversation you have with a friend that is always trying to say something in reply. Never really listening but instead looking for their entry to spit out what they know. You need to listen to hear it.

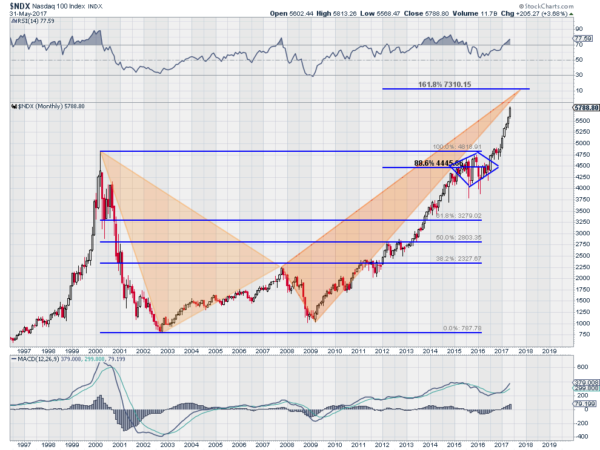
The monthly chart above of the NASDAQ 100 offers a great example. If you look at this chart there is no doubt which way prices have been moving since February 2016. The only question remaining is how far will this market go. Nobody know for sure. There are two suggestions in this price action though. The first comes from a harmonic pattern called a Deep Crab. This pattern relies on Fibonacci retracements, ratios that the eye sees in nature all the time and has grown accustom to over our lives. The Deep Crab gives a target of 7310 on the Nasdaq 100. Translation: It says there could be a lot of room higher still.
The second requires a look back to the bottom in 2009. The NASDAQ ran higher from there and paused at the start of 2015. That pause, at a 88.6% retracement of the move lower from the Tech Bubble crash, took on the form of a Diamond over the next 18 months. A Diamond pattern is often considered a topping pattern, but it can resolve in either direction. This one resolved to the upside. To get a target we add the move into the Diamond to the break out level. This gives a target to 7850. Translation: A lot higher.
Neither one of these patterns guarantee that they will complete, or even move another 100 points higher. But where are you going to place your faith? In what some Bond managers are saying about how signals in Bonds will translate to doom in the stock market. Or in what the price action in the stock market is saying to you directly. Most times it is better to just go to the source and do nothing more than listen.
DISCLAIMER: The information in this blog post represents my own opinions and does not contain a recommendation for any particular security or investment. I or my affiliates may hold positions or other interests in securities mentioned in the Blog, please see my Disclaimer page for my full disclaimer.
