Defense can also save your portfolio so that you’re able to invest for another day. The wheels started to come off of risk six months ago when High Yield bonds began to significantly underperform Equities. As the market blamed the divergence on the weakness of Energy and Material credits, the weakness spread to Investment Grade bonds. Then came declines in European Financials which has now infected U.S. Financials. The continued weakness in credit and financials is disturbing and a sure reason to have your best defense on the field right now. While few would suggest that a recession is near given the strength in jobs, worries are rising that the declines in the equity and debt markets could pressure the economy into further slowing. Don’t forget that the markets will often move both higher and lower than you might believe. Buying credit and equities to bet against a U.S. recession might seem like a good idea right now, but what if you could place that bet at a much lower price in the future. That is where we are. The market gods are angry. This is no time to be a hero with the Fed in a corner and U.S. presidential election uncertainty building.
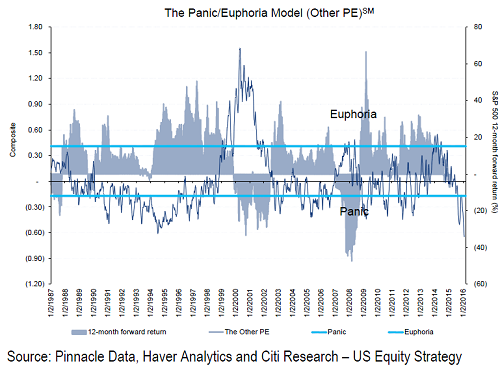
The wheels have come off the Citi Panic/Euphoria model as the index clears to new lows (which will eventually set up solid forward returns)…
Sentimental thoughts from Eric Peters…
Anecdote: “We need a resolution in China,” said Eagle, soaring high above Gotham. “Can’t be sure what it is, or when it will happen, but we’ll know it when we see it.” The pressure on China to devalue is building. They can’t ease aggressively without letting the currency go. But a big devaluation risks Beijing’s political credibility. Social stability. “When a system comes under stress, frauds surface. The scale of corruption in China today is stunning.” Circling back through time, Eagle recounted so many kills. Carcasses. The S&L crisis, Drexel, Russia, South East Asia, Bernie Ebbers, Enron, 2008, Petrobas, and now China. “When crises begin people buy too early. Even congenitally bearish guys, and particularly credit guys.
They feel the high yields will cover their losses. They tell themselves that marks on their positions don’t matter. That’s what I see now.” Crises come in many forms, but they tend to follow Hemingway’s pattern of going broke; they happen gradually, then all at once. “The most bullish market configuration is when sentiment is extremely bullish but positioning is not. And the inverse is also true. I see sentiment growing increasingly bearish but people are still long.” The 2008 crisis started in America, and should have then traveled to emerging markets. But massive Chinese stimulus interrupted the pattern. So instead, it traveled to Europe, then emerging markets, leaving a wide deflationary wake. It’s China’s turn. And until Beijing devalues and unleashes a massive monetary easing no asset class is safe. “You need to be disciplined, patient, and positioned for the devaluation, so that you can be aggressive coming out of it,” said Eagle, rising, waiting, watching. “These things start out slowly, then develop quickly; policy makers themselves don’t realize they’re going to devalue until 72 hours before they move.”
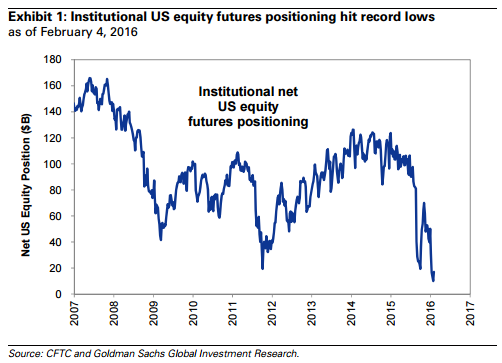
It does appear that Institutional Investors are positioned conservatively looking at the Futures market…
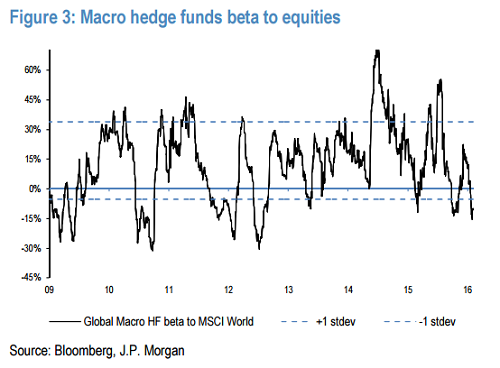
Macro hedge funds have trimmed equity exposure. Their beta to equities is close to the [approaching the] most negative in three years. (JPMorgan (N:JPM))
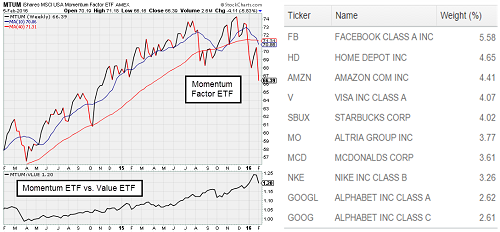
Most hit last week and year-to-date are the Momentum stocks. Remember in December when the market narrowed into only a few out-performing names? Well that was your sign…
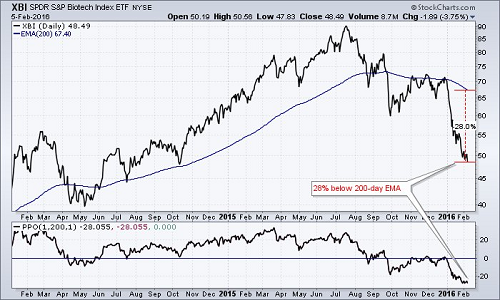
Biotechs have not only lost all of their momentum but small cap biotechs are now trading at their most oversold level in decades…
@ArthurHill: N:XBI is 28% below its 200-day EMA. The most since inception (1996)
One significant shift in equities last week was the buying in the Materials space. Not only did Dow and DuPont (N:DD) have a good week, but there was broad buying across many other commodity players. Just short covering or something more meaningful?
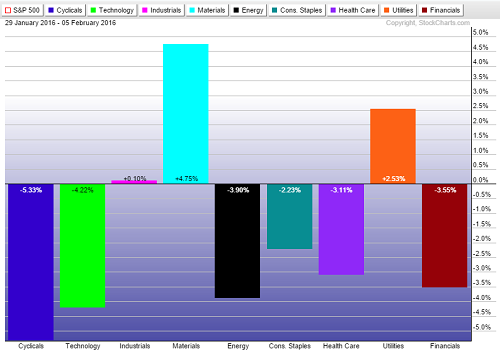
More broadly, it was the non-Energy commodity space that led the markets along with Risk Free Bonds. Energy and Momentum stocks led at the bottom…
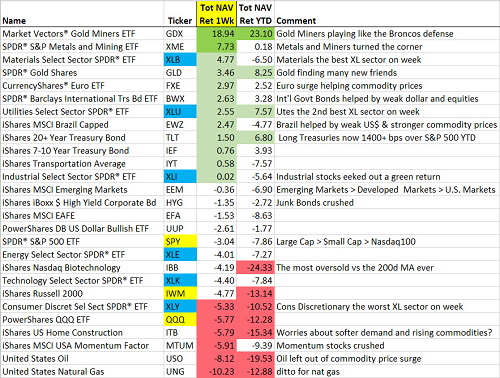
Speaking of gold and the Miners…
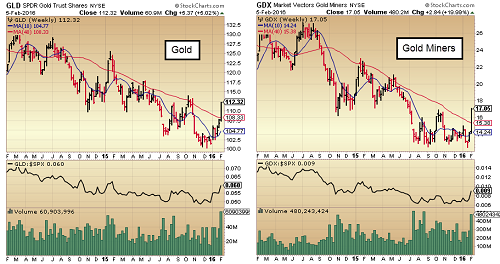
Back to the recent strength in the Materials and Mining stocks, maybe The Leuthold Group is onto something here…
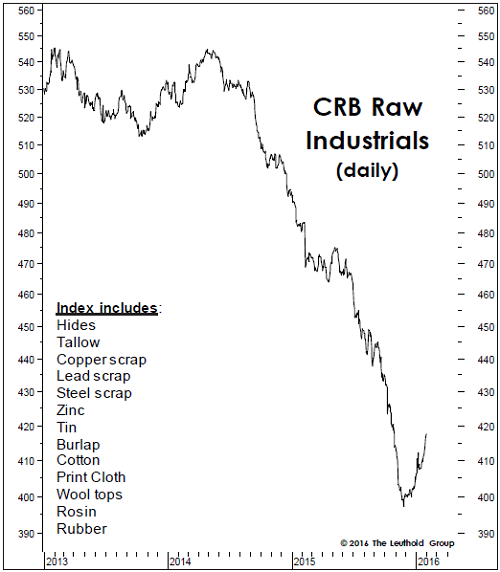
The CRB Raw Industrials index captured, in real-time, the extent of the EM-led manufacturing slowdown throughout 2014 and 2015. We’re now intrigued that the index has quietly managed to rise 5% during a 2 1/2-month span in which global equities are down two to four times that amount.
This is the best action since the spring of 2014. From a contrary perspective, we like that this move has been overshadowed by the daily gyrations in oil. And, unlike the first half of 2014, virtually no one is calling for a sustained rebound in commodities, let alone this group of commodities that’s so closely tied to the fortunes of Smokestack America. This is the most encouraging omen to emerge from the industrial economy in almost two years.
(The Leuthold Group)
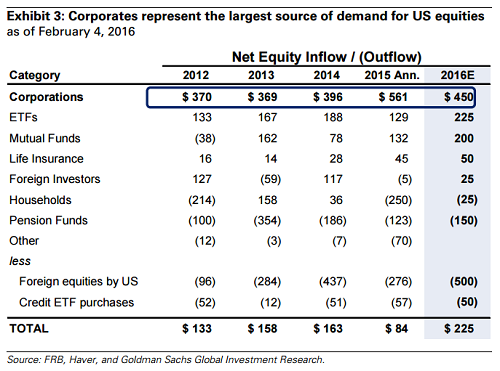
Goldman suggests that Corporate stock repurchasing will help buoy some of the selling by Sovereign Wealth Funds…
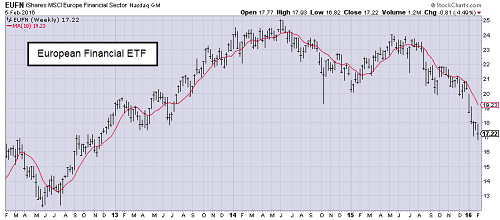
One of the infectious wounds in the market is the collapse in European Financials…
Investors are already running out of patience—and not just with Deutsche. After years of lackluster results, financial scandals, painful share sales, disruptive management changes, onerous regulations and strategic U-turns, many investors are throwing in the towel on European banks.
This year alone, European bank stocks have plunged 18%, compared with the broader market’s 10% tumble, notwithstanding a slight rebound in recent days. Investor valuations of European banks, including Unicredit (L:0Q54), Deutsche Bank (DE:DBKGn) and Credit Suisse Group AG (VX:CSGN), are plumbing depths they last saw during the 2008 financial crisis and the 2012 eurozone sovereign-debt meltdown.
“The selloff is totally indiscriminate,” said a European official whose government bailed out its banks and is now stuck with money-losing stakes in the lenders.
While few experts think Europe’s banks are skidding back into an acute, existential crisis, the chronic problems they face could be similarly painful to overcome.
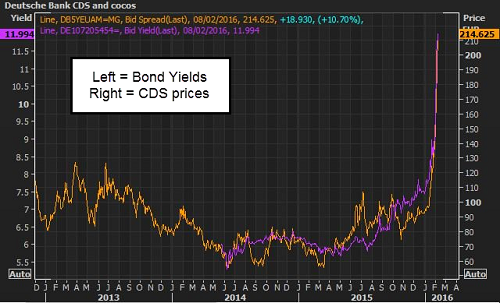
The breakdown of Deutsche Bank stock and credit is leading many to speculate on their loan book and other exposures…
Investors are starting to worry about more than just profit declines at the biggest banks. They’re increasingly concerned about their ability to repay their debt.
A prime example can be found in Deutsche Bank, which is struggling in the face of falling debt-trading profits and an unclear strategy for increasing income. And investors have yet one more thing to worry about: Souring energy prices pose a risk for substantial losses.
Deutsche Bank may have “significant” energy exposure “that is not investment grade and is not well secured,” Amit Goel and Jag Yogarajah, analysts at Exane BNP Paribas (PA:BNPP), wrote in a note on Wednesday. They predicted an increase in loan loss provisions that was larger than the average of a consensus of analysts, who forecast a 19 percent rise, to 1.14 billion euros this year.
On Thursday, Deutsche Bank’s junior subordinated, 6 percent contingent convertible bonds plunged to 76.5 euro cents from 93.2 at the end of last year. Its lower-ranked euro-denominated debt has lost 3.5 percent so far this year, one of the biggest losers among the biggest issuers of such debt, according to Bank of America Merrill Lynch (N:BAC) index data.
New lows on the 20-year chart…
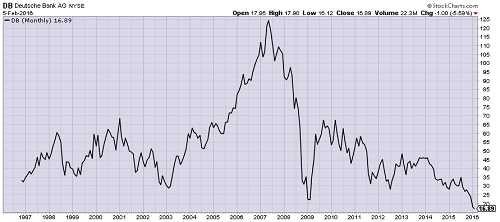
While some throw darts at European Banks, other investors have started to bet against high grade Corporate debt…
Hedge funds are betting the next bond sector to crack will be the $4.5 trillion market for the safest U.S. corporate debt.
New York’s Perry Capital has placed a $1 billion wager against investment-grade bonds issued by 10 companies it thinks are especially susceptible to an economic downdraft, rising interest rates or are on the wrong side of change in their industries, people familiar with the matter said.
The bet and others like it reflect a belief that this year’s economic uncertainty and market turbulence are evidence of deeper problems that won’t be confined to vulnerable areas such as energy and junk bonds.
So severe was the impact of foreign exchange rates that on a constant currency basis, sales in the quarter would have been $5bn higher — or “about the size of the annual revenue of a Fortune 500 company”, Mr. Cook pointed out.
The selling has become obvious in the BBB rated credit chart…

Jeffrey Gundlach is watching this chart closely and keeping a stack of BUY tickets ready…
“The whole question for me is when am I going to buy enormous amounts of corporate credit, because it’s crystal clear that that’s the next opportunity that’s out there,” Gundlach said. “There’s plenty of things out there that will have 100 percent returns. It’s a whole question of: Don’t tell me what to buy, tell me when to buy it.”
Debt related to energy and mining is still very risky, because of weakness in China’s economy and a worldwide oil glut, he said.
“There’s simply no bullish case for oil right now,” Gundlach said.
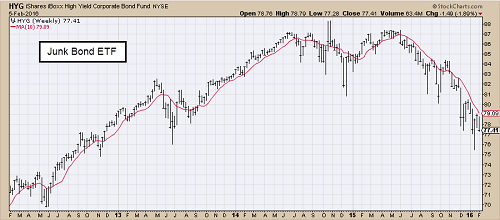
High Yield Bonds (N:HYG) also continue to break down pulling Equities with them…
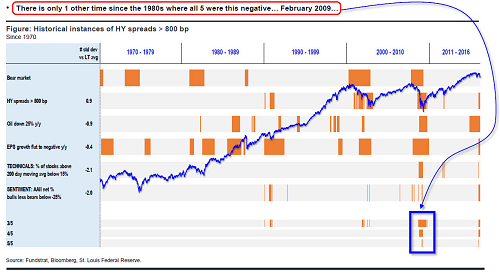
Great chart by Tom Lee showing other times when the negatives have lined up. But can they help Equities ring in a bear market this time?
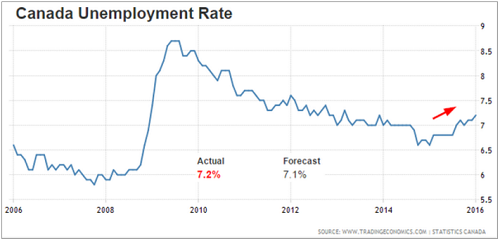
There was lots of focus on Friday’s U.S. jobs data. But the real scary data came out north of the U.S…
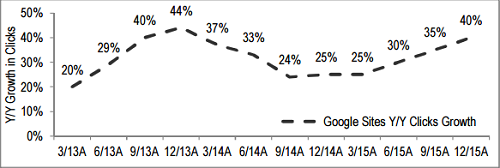
It was a big earnings week. Because of the breakdown in the markets, few paid attention. Google's (O:GOOGL) core business crushed it…
Disclaimer: The information presented here is for informational purposes only, and this document is not to be construed as an offer to sell, or the solicitation of an offer to buy, securities. Some investments are not suitable for all investors, and there can be no assurance that any investment strategy will be successful. The hyperlinks included in this message provide direct access to other Internet resources, including Web sites. While we believe this information to be from reliable sources, 361 Capital is not responsible for the accuracy or content of information contained in these sites. Although we make every effort to ensure these links are accurate, up to date and relevant, we cannot take responsibility for pages maintained by external providers. The views expressed by these external providers on their own Web pages or on external sites they link to are not necessarily those of 361 Capital.
