The value factor, after a long drought, is showing signs of life. Analysts continue to debate if the revival is more than short-term noise, but for the moment this corner of investing is confounding critics who claimed it was a dead strategy.
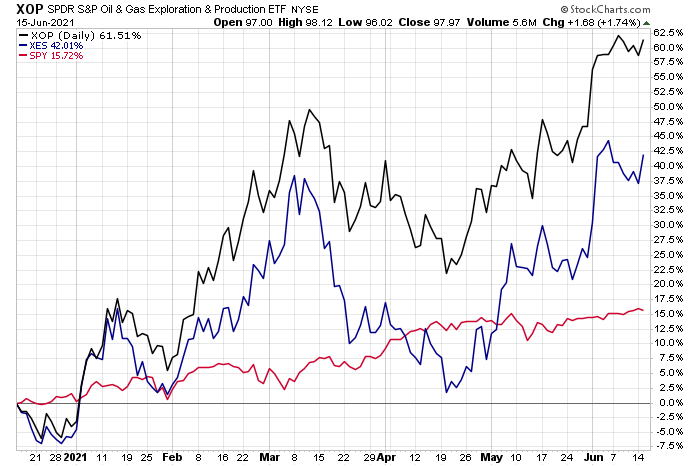
Examples of battered corners of global markets that have posted strong recoveries lately include various slices of the energy sector. Consider SPDR® S&P Oil & Gas Equipment & Services ETF (NYSE:XES) and SPDR® S&P Oil & Gas Exploration & Production ETF (NYSE:XOP). Both equity funds have routinely featured in this periodic report as suffering some of the deepest losses over the trailing five-year period (see
CapitalSpectator.com’s previous update, for instance. By contrast, both funds have soared over the past six months, beating the broad stock market — SPDR® S&P 500 (NYSE:SPY) — by a wide margin through yesterday’s close (June 15).

To be fair, not every deeply discounted market corner has rallied. For those that do, the recovery path can be unusually volatile. But for investors with a taste for contrarianism as a potential path to outsized gains, monitoring out-of-favor assets has its charms.
The question, of course, is how to define the value factor? That’s a huge subject and far beyond the scope of this review. Indeed, value investing comes in a rainbow of variation and if you ask ten value investors how they practice their craft, you may get ten different answers.
In this column the definition is a simple ranking of trailing 5-year return, an idea outlined by AQR Capital Management’s Cliff Asness and two co-authors: “Value and Momentum Everywhere.” There are numerous measures of value and so no one should confuse the 5-year-performance benchmark as the definitive yardstick of finding bargain-priced assets. But as a starting point for identifying where the expectations have fallen sharply, the 5-year change is useful.
Another advantage of using a 5-year performance measure: It can be applied over a broad set of assets, thereby leveling the analytical playing field. It doesn’t hurt that this metric is simple and therefore immune to estimation risk, which can complicate accounting-based value-investing gauges, such as price-to-book and price-to-earnings measures. In short, the 5-year return is a handy tool for sifting through a wide array of assets in search of high expected return.
There are no guarantees that value, no matter the definition, will generate superior performance anytime soon, if ever. Recent history certainly leaves plenty of room for doubt. But kicking the tires is free.
The ranking below covers 147 exchange-traded products that run the gamut: US and foreign stocks, bonds, real estate, commodities and currencies. You can find the full list here, sorted in ascending order by annualized 5-year return — 1260 trading days — through yesterday’s close (June 15, 2021).
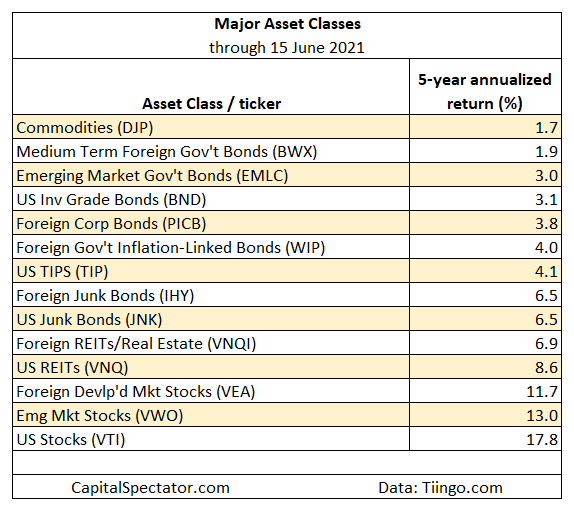
Let’s begin with the major asset classes. On all fronts, gains are now the norm. Nonetheless, a wide range of gains prevail and so on a relative basis one could argue that the value factor is still visible to a degree for this list.

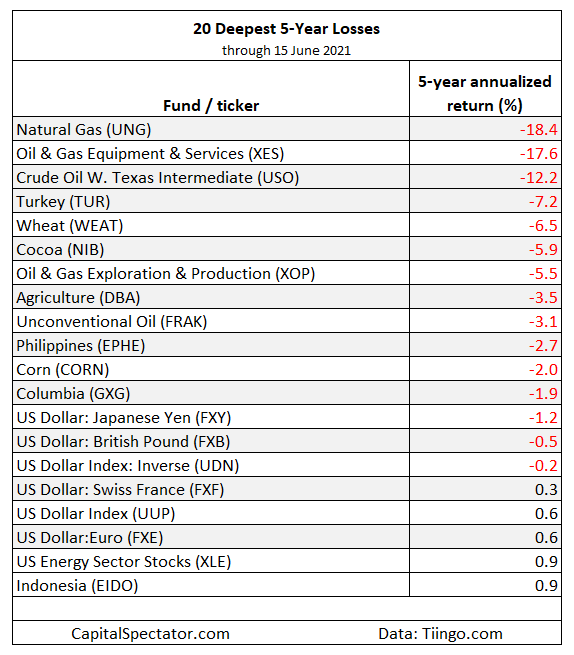
The real bargains (or value traps?) are found in the extreme depths of loss. The next table below highlights the ETFs with deepest declines. Note that SPDR® S&P Oil & Gas Equipment & Services ETF (NYSE:XES) remains close to dead last for our list of 147 funds. That doesn’t preclude sharp rallies, as recent history reminds. But even after XES’s rally of late, the ETF still has a long road ahead to climb out of it’s relative-ranking hole.

