Despite a general rise in global markets over the past year, the well never runs dry in the search for out-of-favor assets. Whether these assets are value traps or opportunities is the enduring question. But at least we have a good starting point: trailing 5-year returns.
The value-investing concept remains on the defensive, although some variations of the strategy are showing hints of a revival in recent months after an extended drought. Skeptics remain unconvinced, but in some corners there’s fresh hope for a revival for strategies favoring assets that appear to trade at discounts to some measure of inherent worth.
The basis for thinking positively draws on the assumption that buying assets on the cheap leads (eventually) to relatively high risk premia. The price tag for outsized returns: patience, sometimes in extra large (and extended) doses.
Mr. Market’s verdict, however, is a fickle thing and so value investing results wax and wane with a high degree of irregularity. With that in mind, let’s dive into the numbers for a broad-brush update of what appears to be unusually hefty value opportunities (or not) by way of ETFs. The metric for identifying “deep value” is the 5-year return, which is based on an idea outlined in a paper by AQR Capital Management’s Cliff Asness and two co-authors: “Value and Momentum Everywhere.” There are numerous measures of value and so no one should confuse the 5-year-performance benchmark as the definitive yardstick of finding bargain-priced assets. But as a starting point in the process of locating where the crowd’s expectations have stumbled, the 5-year change is useful.
One advantage of using a 5-year performance measure: It can be applied over a broad set of assets, thereby leveling the playing field. Another plus: the metric is simple and therefore immune to estimation risk, which can complicate accounting-based value gauges, such as price-to-book and price-to-earnings measures. In short, the 5-year return is a handy tool for sifting through a wide array of assets in search of high expected return.
There are no guarantees that value, no matter the definition, will generate superior performance anytime soon, if ever. Recent history certainly leaves plenty of room for doubt. The good news: kicking the tires doesn’t cost a dime.
The ranking below covers 147 exchange-traded products that run the gamut: US and foreign stocks, bonds, real estate, commodities and currencies. You can find the full list here, sorted in ascending order by annualized 5-year return — 1260 trading days — through yesterday’s close (Mar. 30, 2021). For additional perspective, here’s the previous ranking.
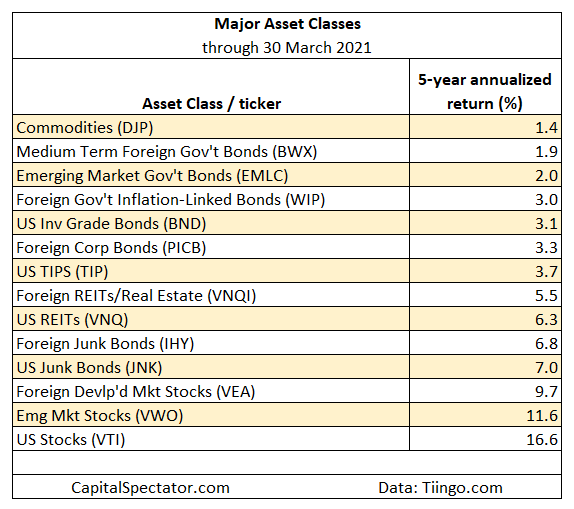
Let’s start by ranking the major asset classes. The main takeaway: red ink continues to be MIA on this front. Value for this cut translates to low/weak gains. By that definition, a broad measure of commodities (DJP) – an exchange-trade note – is still the weakest performer over the past five years. At the opposite end of the valuation spectrum: equities generally, led by US shares (VTI).

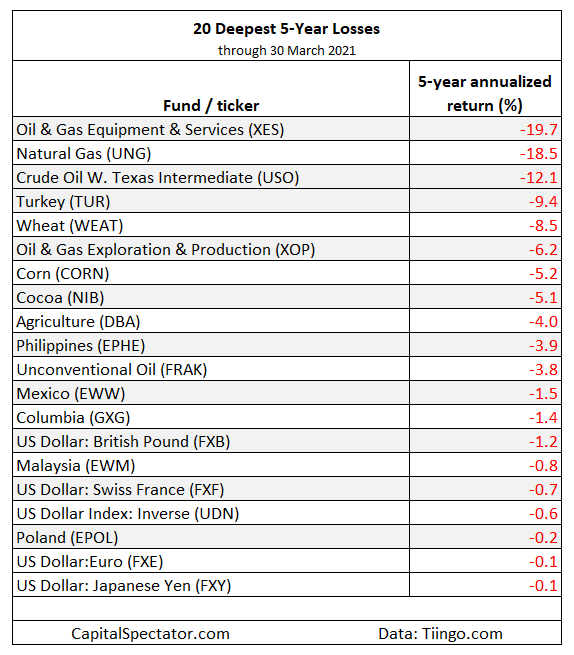
Focusing on the full list, the deepest losses (discounts) start with the SPDR® S&P Oil & Gas Equipment & Services ETF (NYSE:XES), which has lost an annualized 19.7% over the trailing five-year window. In a somewhat ironic counterpoint, the highest return on our five-year list — the poster boy for anti-value, one might say — is also an energy ETF, albeit one of the “clean” variety via Invesco WilderHill Clean Energy ETF (NYSE:PBW), which is sitting on a sizzling 38.2% annualized five-year gain.

