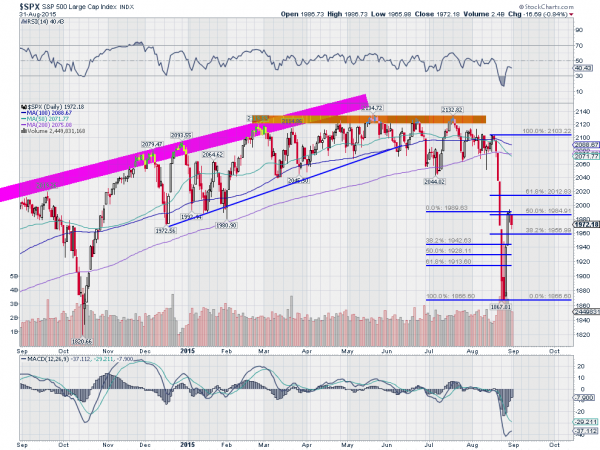
That picture was totally stolen from Peter Brandt (@PeterLBrandt on twitter) and adapted a bit.
With the wild gap down a week ago, the action Monday seemed very sedate. Almost like all market participants were off last week and a bunch of inexperienced babysitters was in charge, and then the staid old timers returned to instill a flat normalcy. That may not be too far from the truth. But the overnight market changed all that.
I read that the China PMI coming in right on top of expectations at 49.7 overnight is the culprit. But it met expectations? Whatever. The S&P 500 SPDR will now have an Island Top to go with the Island bottom. It is starting to look like Greece with all these islands. Or that is what yo might think from the financial press.
You will read a lot about a Dead Cat Bounce today. The morbid term refers to the fact that as a cat falls from a building it may land on its feet but still end up dead, bouncing just a little bit before falling back to earth. I first heard it in 1987, and we had Dead Cat dolls on the desk, but it may be older than that. This bounce or rebound may have been more than that at about 50% of the move down. Can you imagine a cat that fell from the 10th floor bouncing to the 5th floor? But what it is called is not important.

The chart above shows that the S&P 500 had retraced 50% of the fall before starting to turn back. Students of Japanese candlesticks see an Evening Star that formed yesterday, a reversal pattern. From that reversal the S&P will open near a 50% retracement of the bounce leg this morning.
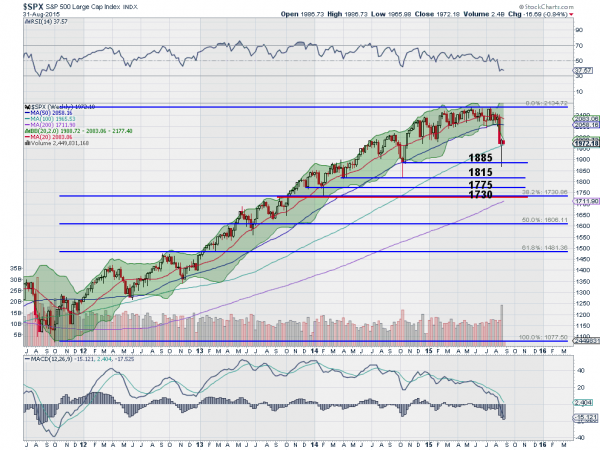
It also gives some important levels to watch in the index if you are trading it today. Around 1913 is a 61.8% retracement of the bounce leg and around the limit of where the S&P 500 should turn back higher if it is not going to fully retrace, marking the completion of a very rubbery dead cat bounce. Below the 1867 low look back to last Monday’s chart below for important levels to watch.

The first one is the 1885 number, about where the bounce Monday last week came. If it retouches that look for many to believe a retest has been made and buyers to show up. At least short term. Unless it runs hard to 1815. The you will hear from the doom and gloom crowd about how the Fed cannot tighten rates, the world is heading into recession and you need to buy gold and ammunition. I am not going to tell you what to do about the market. But I would suggest that any extreme views you read or watch be taken with a grain of salt. But then it is your money, you can do what you want with it.
The information in this blog post represents my own opinions and does not contain a recommendation for any particular security or investment. I or my affiliates may hold positions or other interests in securities mentioned in the Blog, please see my Disclaimer page for my full disclaimer.
