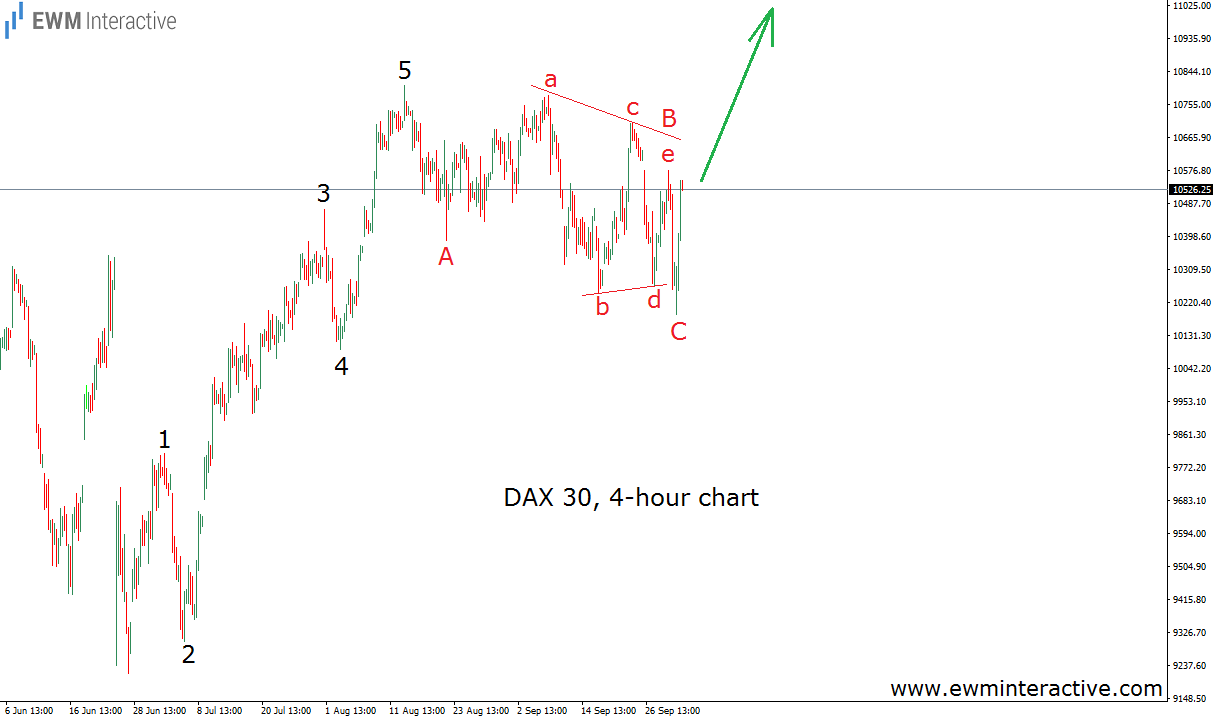
The German DAX 30 index climbed to 10 802 in the middle of August, but has not been able to reach those highs ever since. Prices have been moving sideways for over a month and a half now. Last Friday, the bears managed to touch 10 190, but their efforts were brought to nothing by the bulls, who returned to lift the index to 10 531 so far. But in order to find out what all this means, we need to take things a little further and see the price development before the August high. The 4-hour chart of DAX 30 allows us to do that.

On June 27th, the index formed a bottom at 9214, which gave the start of the recovery to 10 802 in August. As visible, the wave structure of this advance is clearly impulsive, labeled 1-2-3-4-5. The most important Elliott Wave postulate is that every impulse is followed by a three-wave correction in the opposite direction. So, the weakness from the top at 10 802 is nothing more than a natural retracement. To be more precise it looks like an A-B-C zig-zag correction with a triangle in wave B. From now on, the uptrend should resume and the DAX 30 is supposed to continue in the direction of the impulsive sequence. If this is the correct count, the 11 000 mark should be the bulls’ first target. But what about their second target?
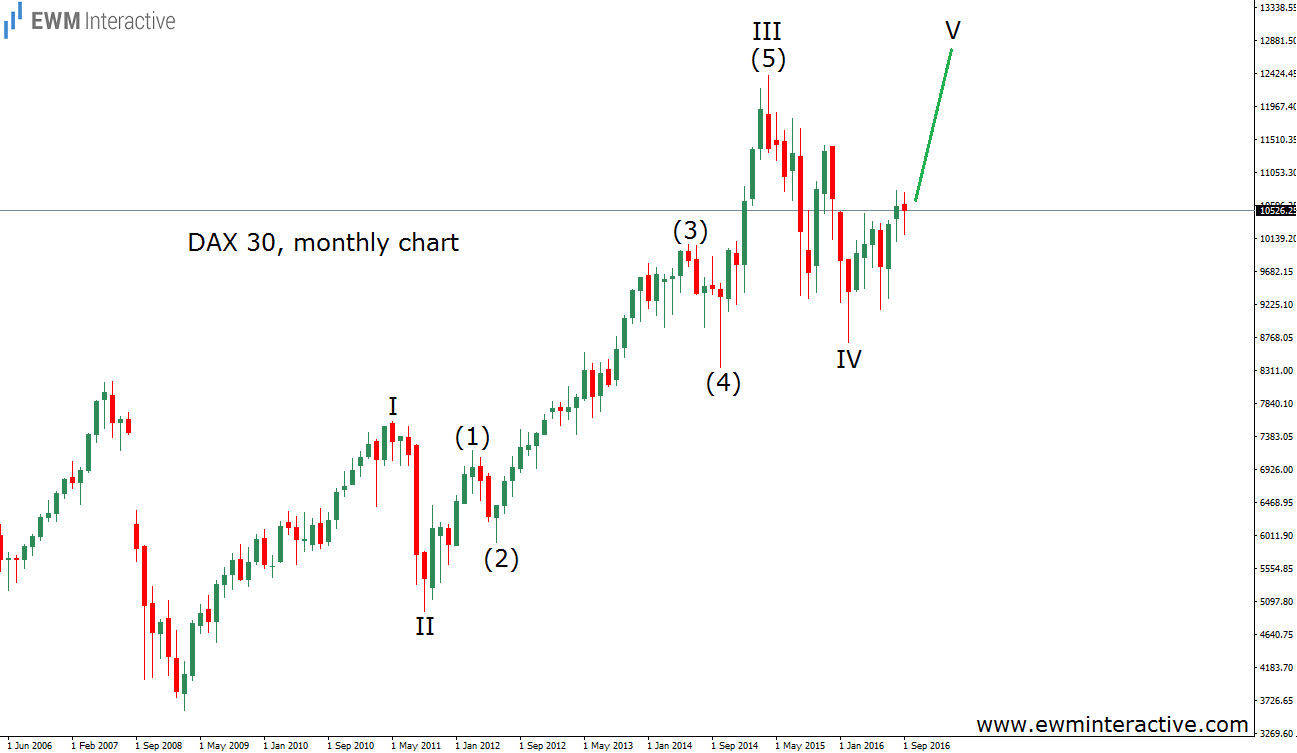
If we want to gain perspective on the big picture, we need to take a look at the monthly chart of DAX 30. And it shows that we are probably in the fifth wave – V – of the larger uptrend, which began in March 2009. Wave III ended at 12 391. Wave V is expected to exceed this level, so 12 400 seems to be an appropriate second bullish target. If this analysis is correct, the stage is set for a new all-time high in the DAX 30.
