It has been a bad week for the German DAX 30. The benchmark index saw its worst weekly selloff in over two years after it plunged from 13 387 to 12 700 for a total loss of 5.1%. The crash seems a bit surprising to economists, who expected the stock market’s rally to continue on the back of a strong economy and a positive trend in corporate earnings on both sides of the Atlantic.
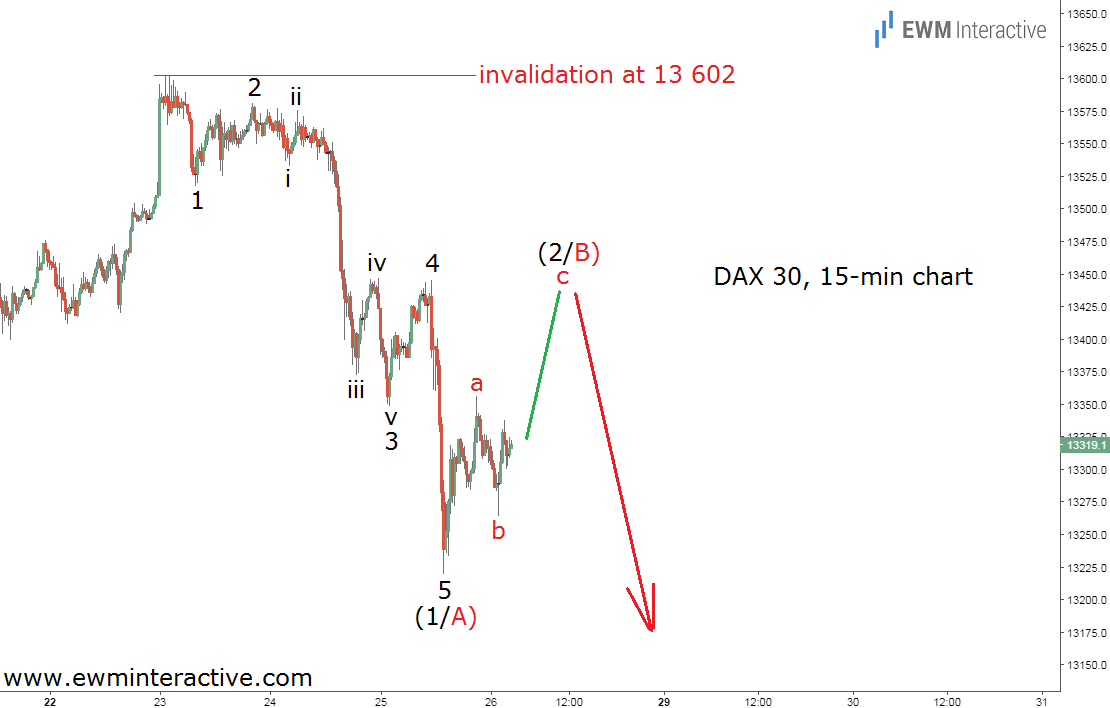
Elliott Wave analysts, on the other hand, were given plenty of time to prepare for this sharp decline in the German stock market. In “DAX 30 Elliott Wave Pattern Puts 12 700 in Danger” , published on January 26th, we shared the following chart with you.
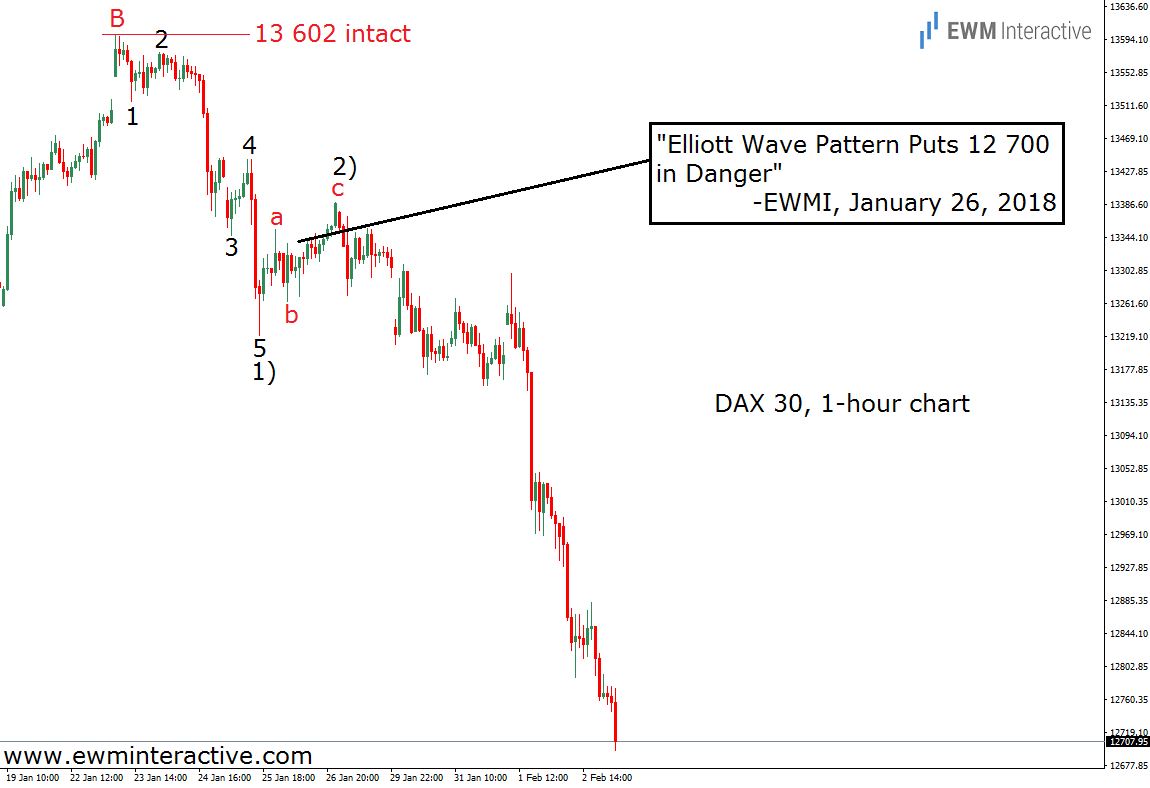
The 15-minute chart of the DAX 30 allowed us to recognize a five-wave impulse from 13 602 to 13 220. This pattern occurs only in the direction of the larger sequence. Since it was pointing south this time, we assumed that as long as the price stays below the starting point of the impulsive decline at 13 602, more weakness should be expected. Given the weekly outlook, 12 700 seemed like a reasonable bearish target. One trading week later, the hourly chart of the DAX 30 index looks like this:

13 387 was the best the bulls were capable of achieving, so the invalidation level at 13 602 was never put to a test. Instead, the bears took control of the situation again and quickly shattered all hope the bulls might have had left. By Friday, February 2nd, the DAX 30 was down to 12 699 (Oanda).
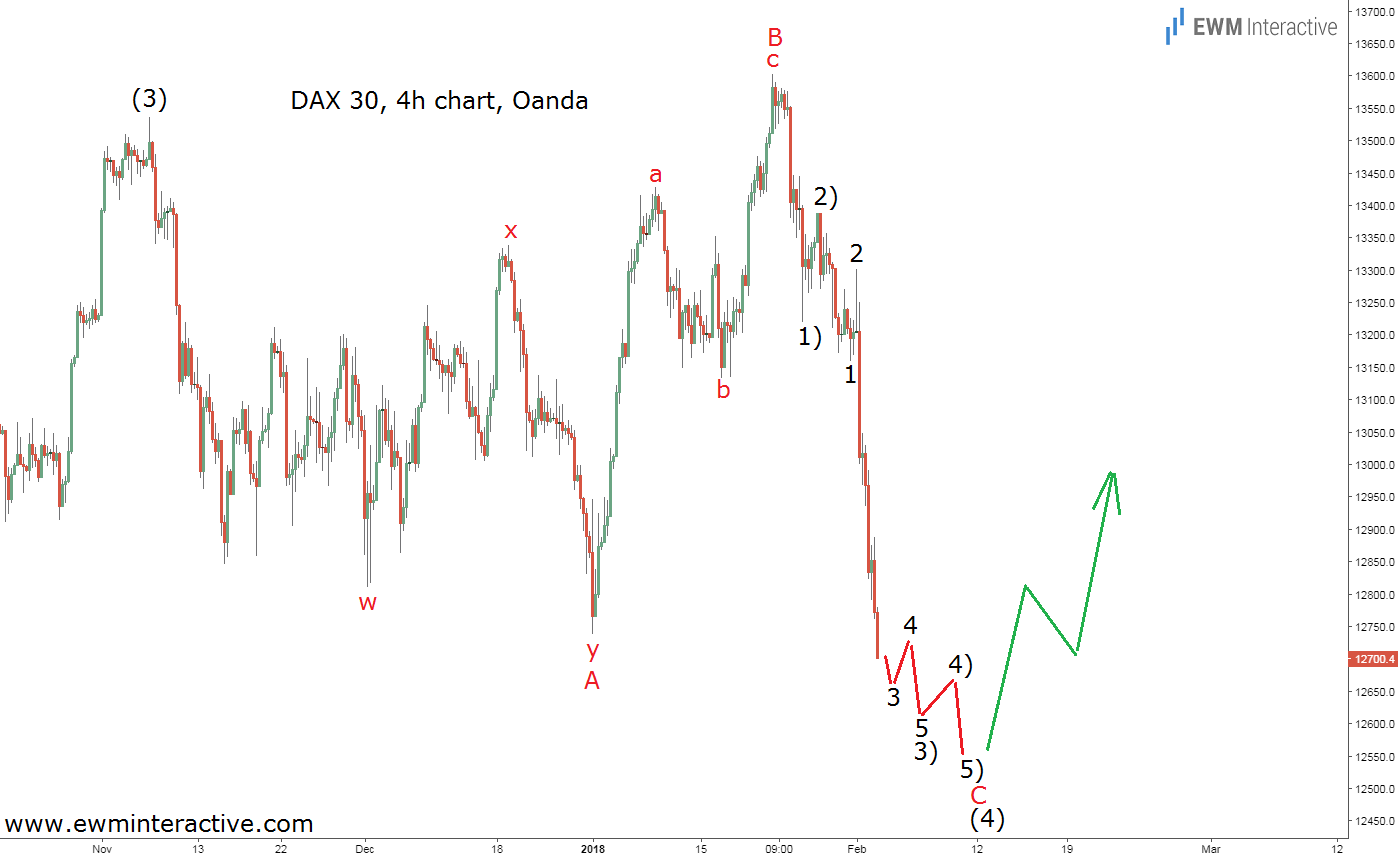
In order to find out what lies ahead, we need to see where does the recent selloff fit into the bigger picture. The 4-hour chart below is a good place to look.

The 4-hour chart makes the entire price action since November 2017 visible. It reveals that something very similar to an expanding flat correction has been in progress during the last three months. A three-wave decline in wave A made way to a three-wave rally in wave B to a new all-time high, before wave C dragged the DAX 30 to where it is today.
If this count is correct, we could expect the bears to conquer 12 500 this week. After that, the A-B-C expanding flat correction in wave (4) would be complete. Once it is over, the larger uptrend is supposed to resume in wave (5), whose targets lie above 13 600. In this respect, last week’s tumble is not that scary. It looks more like another dip to take advantage of.
