The German DAX 30 benchmark index did not perform as impressive in 2017 as its U.S. alternative – the Dow Jones Industrial Average – but it still managed to add 11.9% last year. At one point in November, the index was actually up by 18.2%, when it touched an all-time high of 13 535.
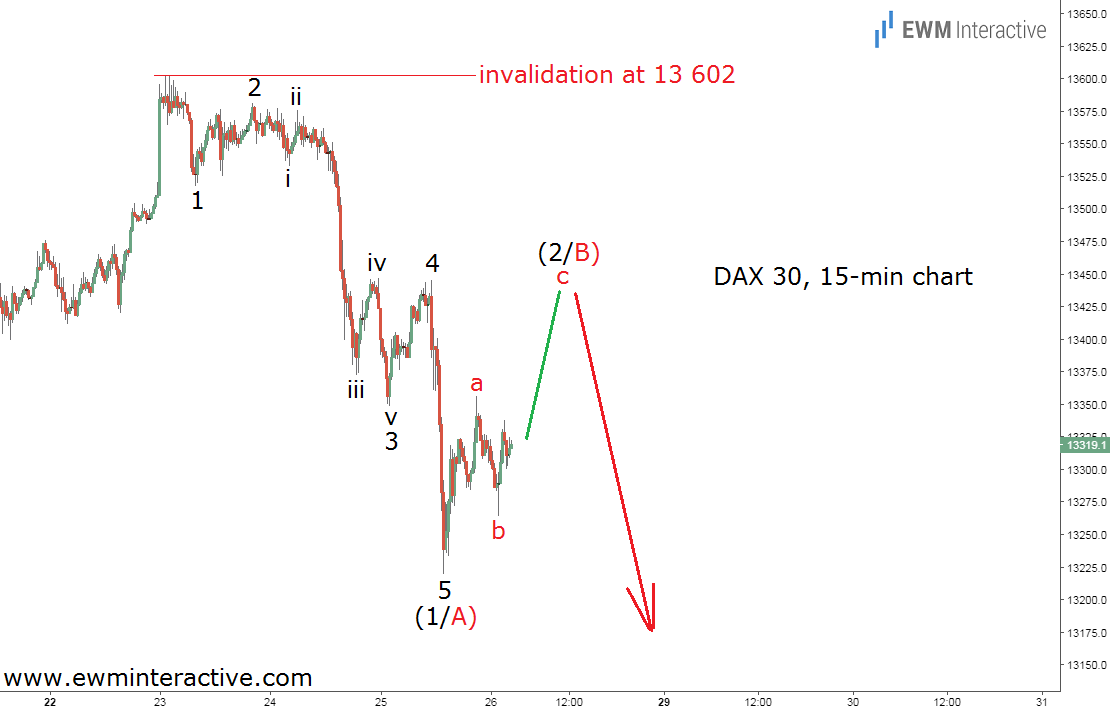
This week, its winning strike continued with yet another record of 13 602 registered on January 23rd. Unfortunately, the bulls could not maintain the momentum, which lead to a swift pullback to 13 220 two days later. In order to find out what the recent weakness means and should we expect more of it, let’s take a look at the 15-minute chart of the DAX 30 below, which is going to visualize the wave structure of that decline for us.

This does not look good for the bulls. The selloff between 13 602 and 13 220 looks like a textbook five-wave impulse pattern. The sub-waves of wave 3 are also clearly visible. According to the Elliott Wave Principle, this pattern means the German DAX 30 is in bearish mode, at least in the short-term, because once the corresponding three-wave a-b-c recovery in wave (2/B) ends somewhere near the resistance area of wave 4, the trend should resume in the direction of the impulsive sequence.
In terms of price, chances are good the bulls would be able to lift the price to roughly 13 450, but once there, they would make way for the bears again, whose first targets lie below the bottom of wave (1/A) at 13 220. As long as the invalidation level at 13 602 is intact, the DAX 30 remains under bearish jurisdiction. Traders should also keep in mind the bigger picture, because the recent small slump might be giving the start of a bigger one in wave (4). If that is the case, 12 700 is in danger, as well.
