It was nice to take a couple weekends away from writing and the timing couldn’t have been better.
My free, near daily blog is always running at www.wizzentrading.comif you’d like my view on the S&P 500 on a nightly basis on top of my view of the charts for the precious metals here on the weekends.
Markets and most stocks are acting very sloppy so I am just watching and enjoying some time outside the office until things setup better.
Between the NYSE computer issues, Greece and the Chinese making up rules as they go there is just too much risk.
Half the battle is saving your powder for the easy money and it will come but trying to trade this type of action that sees huge gaps overnight is just a guessing game for now and one I’m not willing to participate in.
The metals continued to move lower as the charts have suggested and that’s that.

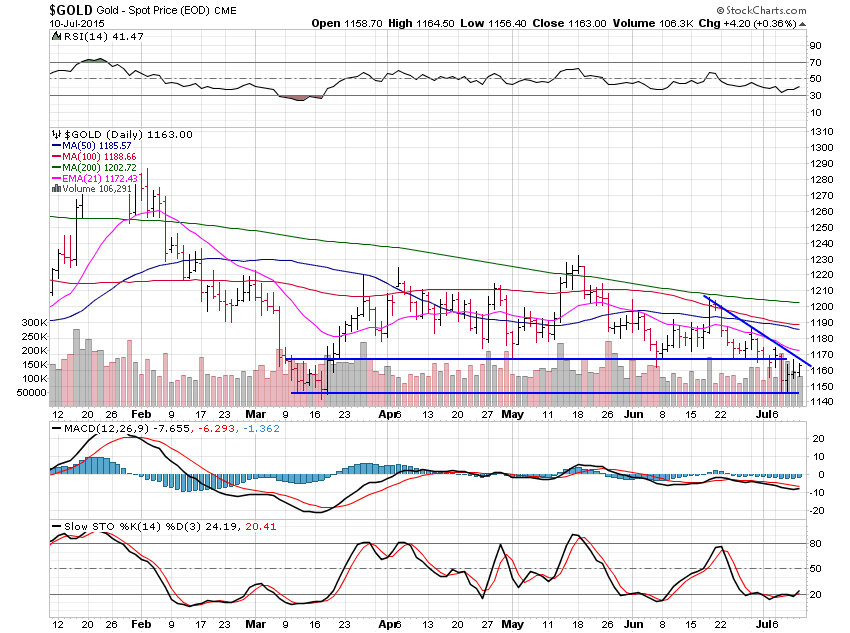
Gold lost only 0.19% this past week but is showing weakness, with more likely not too far away.
Support now sits at the $1,145 level with resistance at $1,170.
The dominant trend remains lower and I still see the $1,000 area as needing to be tested to really wash out this market but it won’t happen right away.
It’s been a month now since I’ve gotten any hate mail from the perma-bulls who get upset with me when I just read a chart and tell what said chart tells me.
Those people had one day to take advantage of being able to tell me the charts are wrong on June 18th and it’s been down hill ever since.
I’m sure they’ll get another nice day to the upside to come at me.
Being stubborn is pure stupidity in markets and those who are stubborn are soon broke.
This game is singularly about making money, not about being right, never forget that.

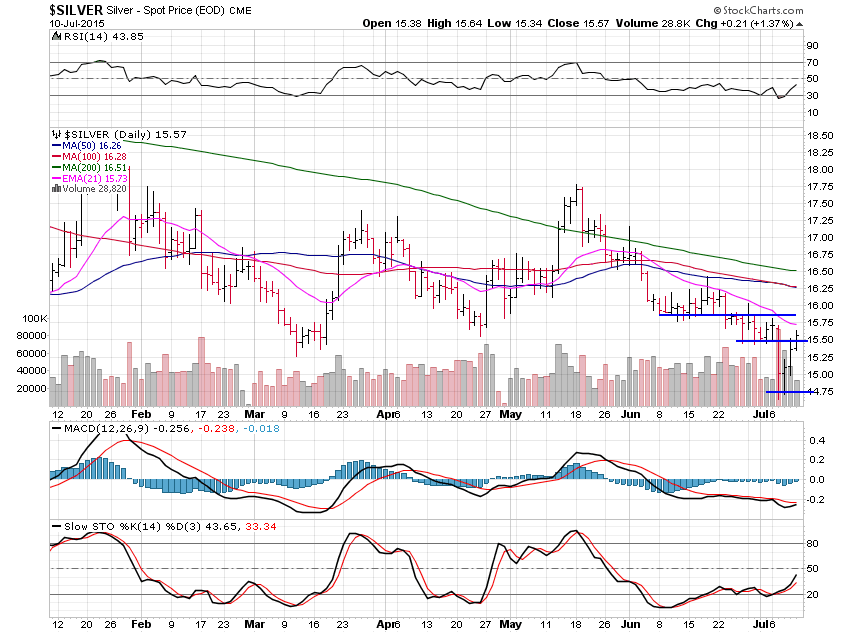
Silver lost 0.51% this past week and is nearing the end of this bounce by the looks of it.
That doesn’t mean it will rip to the upside, although it may get a nice day or two, but some consolidation and sideways action would be best before we see a further swoon towards the ultimate low around $10 that may well come later on this year.
Don’t fight the trend, but the trend takes breaks.
Silver should see some resistance around the 21 day average and it is trying to build a small support level at $14.75 at the moment.

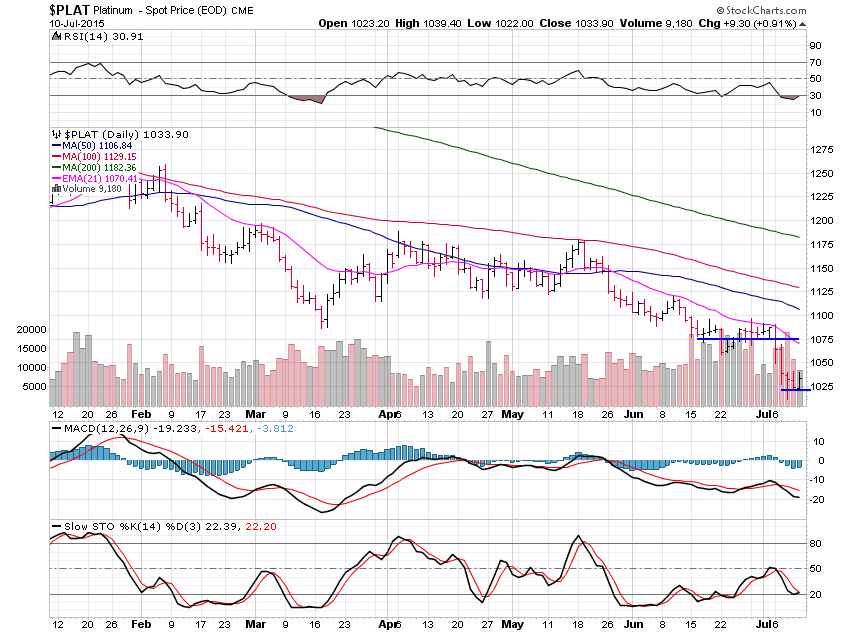
Platinum lost a hefty 4.90% this past week and is now trading in a wide range between $1,025 and $1,075.
This range could last a few days or a couple months but the dominant trend is still down.

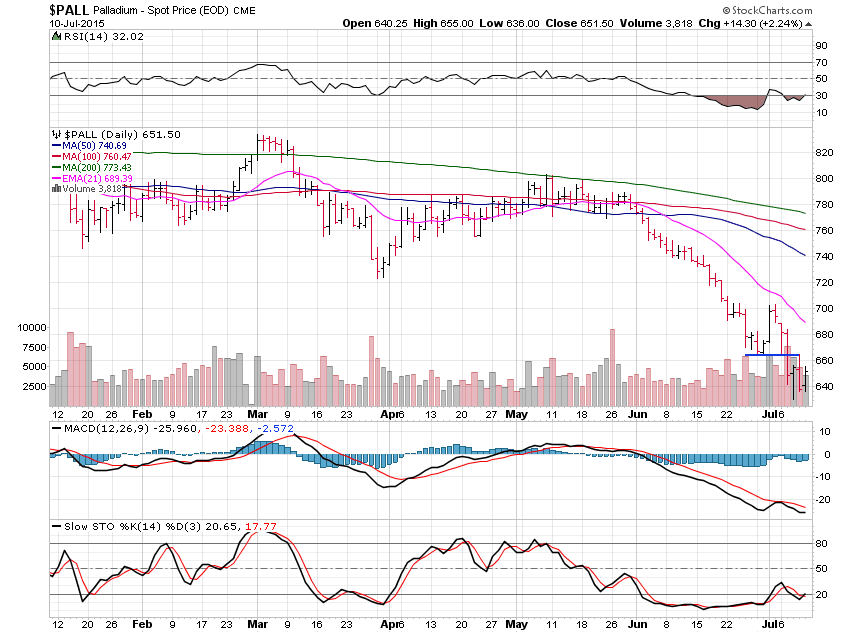
Palladium lost a heavy 6.05% over the last week.
A nice move lower here with resistance just above $660 and a little new support is building at the $640 area.
Major support still sits way down at $550 and we are heading in that direction but it won’t be a straight line.
One day does not make a trend no matter how excited that one day may make some people.
Have a great weekend and try not to rush trades, let them come to you.
Summer is a short season where I live and so far markets are cooperating and letting me relax more than usual and I highly recommend it to everyone.