Once again the Eurozone is in the spotlight, with trading desks around the world highly focused on the latest developments there.
European Central Bank president Mario Draghi made a couple of comments that spooked already jittery fixed income markets. The ECB adjusted the inflation forecast for 2015 higher based on the latest CPI report (discussed yesterday). More importantly, Draghi said the ECB has no plans to ease the latest bond market volatility, which many central bankers view as healthy.
Bunds took another leg down with the 10-year yield pushing toward 90 basis points. This is the largest two-day decline in bunds in some 17 years. The bund futures price is shown below. 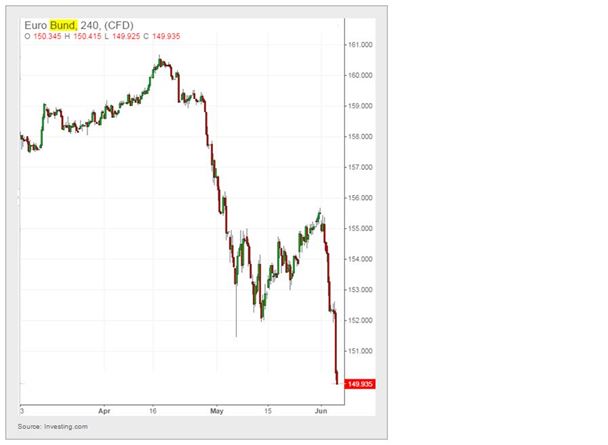
This feels overdone, given the amount of paper yet to be bought by the ECB and the national central banks, but nobody wants to be catching a falling knife.
Other yields rose as well; here is Portugal's 10-year government yield. 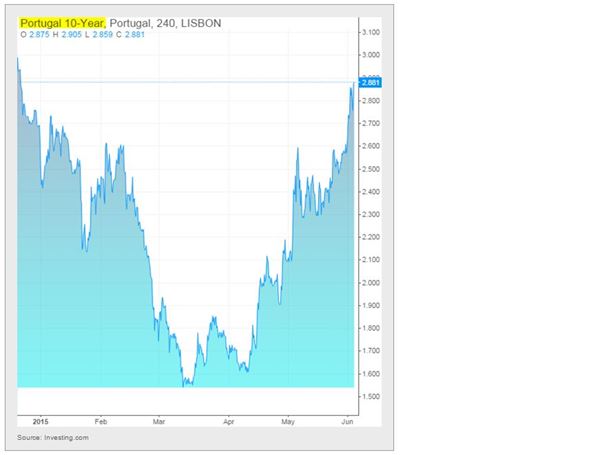
Investors seem to be confident that a deal will be reached with Greece any day now. Perhaps. In the meantime, the deposit outflows from the Greek banking system have increased Greek Target2 liabilities to the Eurosystem.
This is roughly what the Bank of Greece owes to Bundesbank in case of Grexit (note that's in addition to what the Greek government owes to the troika institutions). That's why the Germans are so motivated to find a solution. 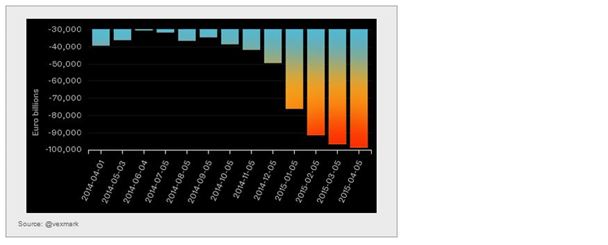
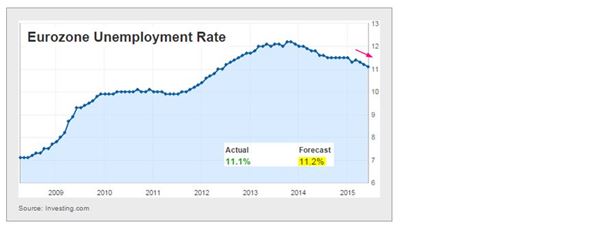
High unemployment in the Eurozone remains a major concern, but it continues to improve. Italy's unemployment rate seems to have peaked (for now), and the jobless rate continues to decline for the euro area as a whole. Both figures beat expectations. 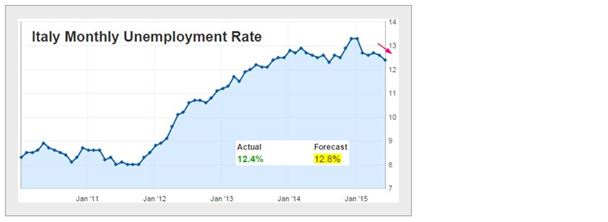
Switching to emerging markets, we continue to see China's equity markets move higher as the Shanghai composite recovers all of the recent losses. Trading volume remains elevated – a broker's paradise. 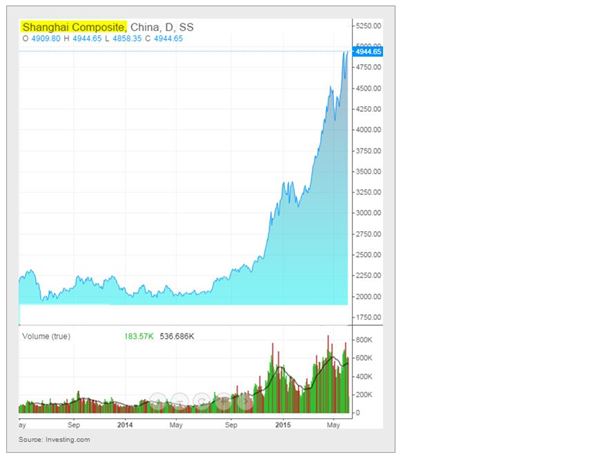
Brazil's services sector contracted sharply in May. The composite output PMI indicator shows that the nation's economy is in a recession. 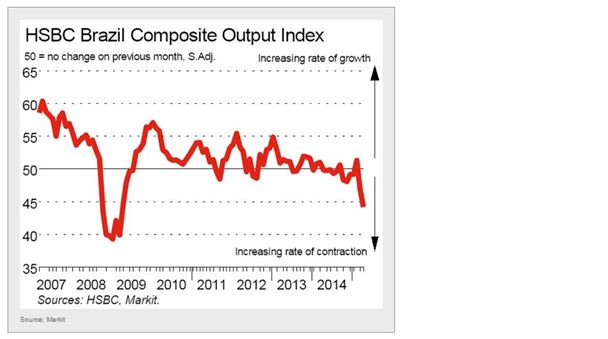
To add to the pain, Brazil's central bank hiked rates again in order to fight inflation and defend the real. With short-term rates at 12.75% and possibly going higher, a quick recovery is not in the cards. If the Fed hikes rates soon, the situation will worsen. 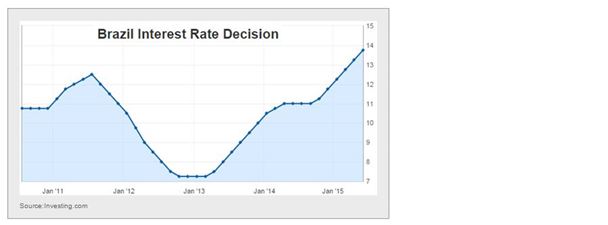
Russia's services sector seems to be improving, as the PMI shows its first expansion in months. Is the economy turning the corner? 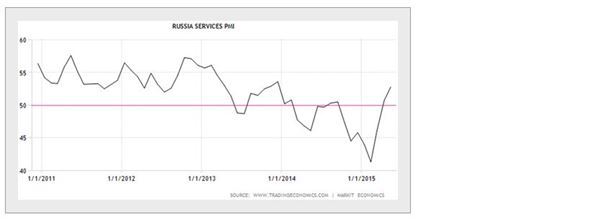
Finally, some food for thought...
In Europe, there is little optimism about the next generation being better off financially. 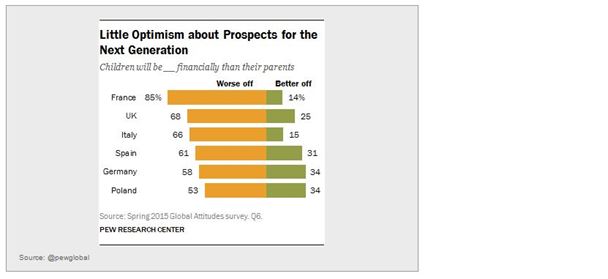
Disclosure: Originally published at Saxo Bank TradingFloor.com
