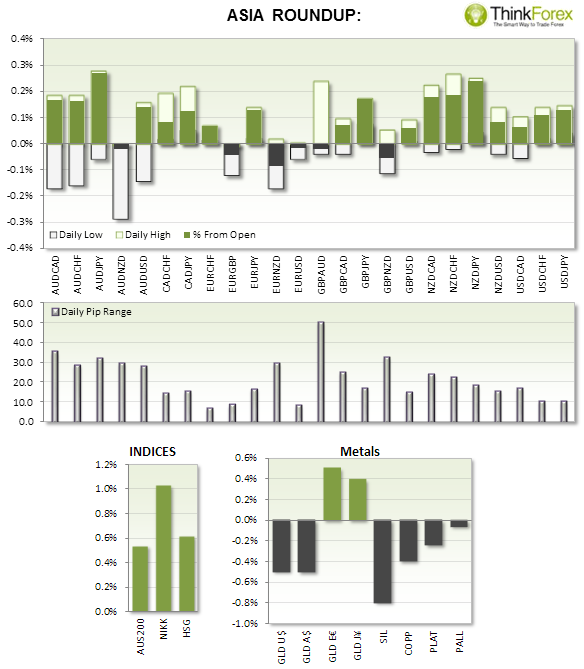
As to be expected on a Monday with little news, trading was relatively subdued across the board
- NZD/CAD provided one of the cleaner charts to continue gains from last Friday, following poor employment data from Canada.
- AUD/NZD remained above last week’s lows and above critical support
- NZ homes saw a modest contraction of house prices at -0.3% but above the previous rate of -1.2%.
- JPY revised industrial production beat estimates to come in at 0.7%,a 2-month high
Bank of Japan began its 2-day policy meeting today which initially saw the Yen lower
- EUR industrial production is expected to grow at a slower rate. However as German and French industrial production are released earlier and account for 50% of the Eurozone Economy, it has already provided us an indication of today’s number.
- Draghi’s speech will be used for clues in regards to future monetary policy. With EUR/USD clearly within range and restricted volatility EUR/USD is best left for the lower timeframes until more direction (and volatility) presents itself.
TECHNICAL ANALYSIS:
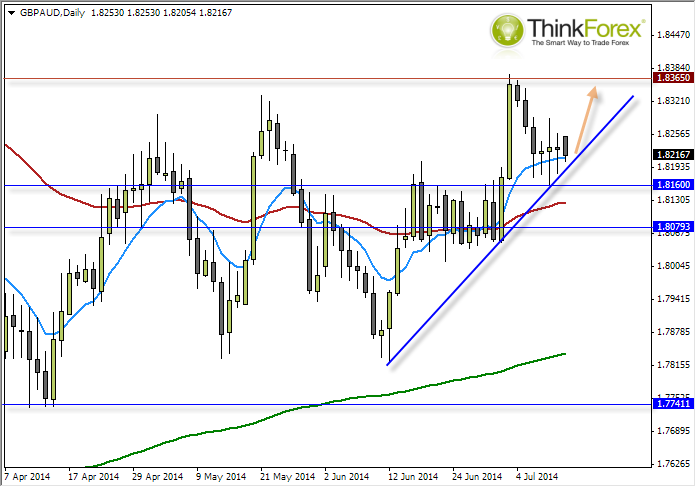
GBP/AUD: Finds support at 10-day sMA 
This follows up on a post form last Thursday but the setup is essentially the same. Price has continued to respect the internal trendline (between the 1.775-1.836 sideways trading-range). Due to the range being well established I expect a price reaction at the highs if we make it there, so I have decided not to try and anticipate a bullish breakout just yet.
Thursday’s candle closed with a long-legged Doji which respected the 1.816 support level to suggest a swing low has formed.
Whilst we remain above the trendline then you could considering entering live at market above the trendline, or setting a buy-limit to achieve a [potentially] higher reward/risk ratio.
A break of the trendline invalidates the setup and will be put aside until we see a direct break below 1.080
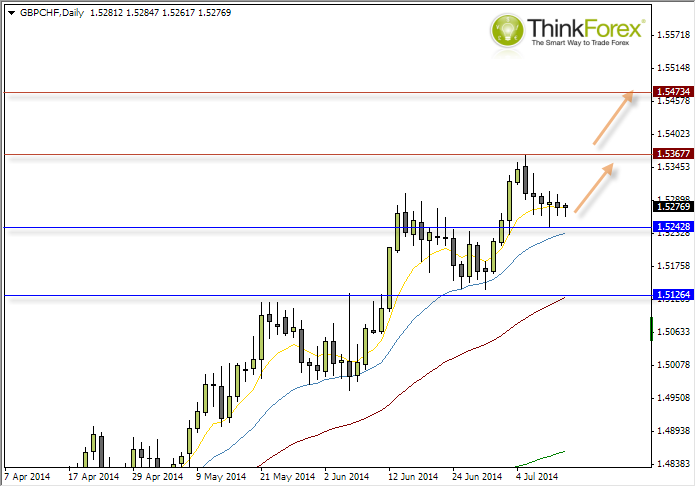
GBP/CHF: A good candidate for ‘buying the dip’
Since breaking to new highs GBP/CHF has floated down towards support and now very much in my bullish watchlist. The higher-highs and lows are well formed and volatility has reduced enough to warrant a buy-stop (something I rarely do these days).
If we break below 1.525 then we may find stringer support at 1.5126 as this is the 50-day / 200-week MA. Until such an event I can only assume the near-term bullish trend will continue.

