The Daily Edge is authored by Ivan Delgado, 10y Forex Trader veteran & Market Insights Commentator at Global Prime. Feel free to follow Ivan on Twitter & Youtube weekly show. You can also subscribe to the mailing list to receive Ivan’s Daily wrap. The purpose of this content is to provide an assessment of the conditions, taking an in-depth look of market dynamics – fundamentals and technicals – determine daily biases and assist one’s trading decisions.
Let’s get started…
- Scan Of The Markets
- Insights Into Market Flows (Video)
- Recent Economic Indicators
- Educational Material
Scan Of The Markets
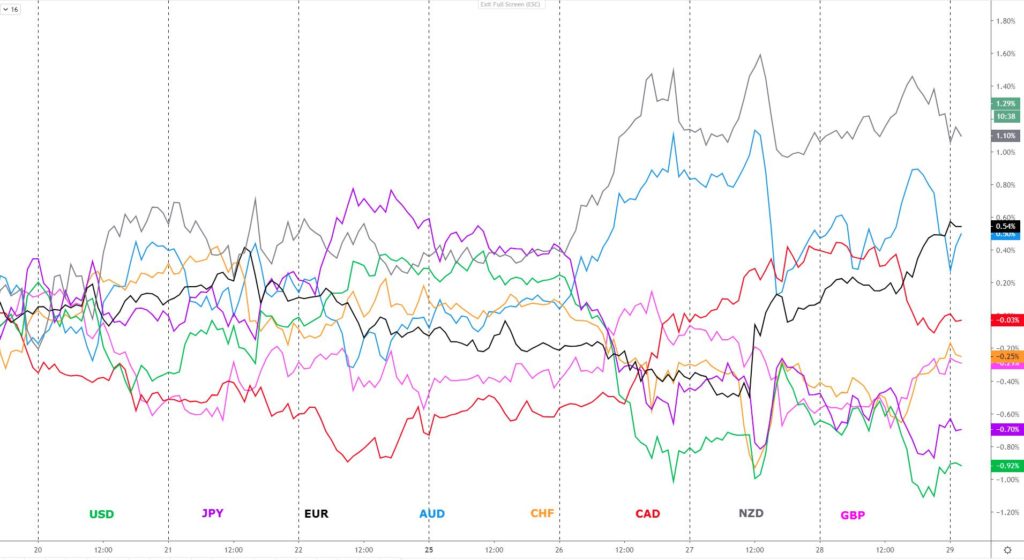
The indices show the performance of a particular currency vs G8 FX. A video on how to interpret these indices can be found in the Global Prime’s Research section.
The overall dominance of ‘risk on’ dynamics in financial markets continues to be better expressed through the trading of currencies, where the US Dollar and the Japanese Yen remain on the back-foot, as opposed to the more lethargic yet predominately bullish picture in equities, where the S&P 500 saw a late selloff to end up neutral.
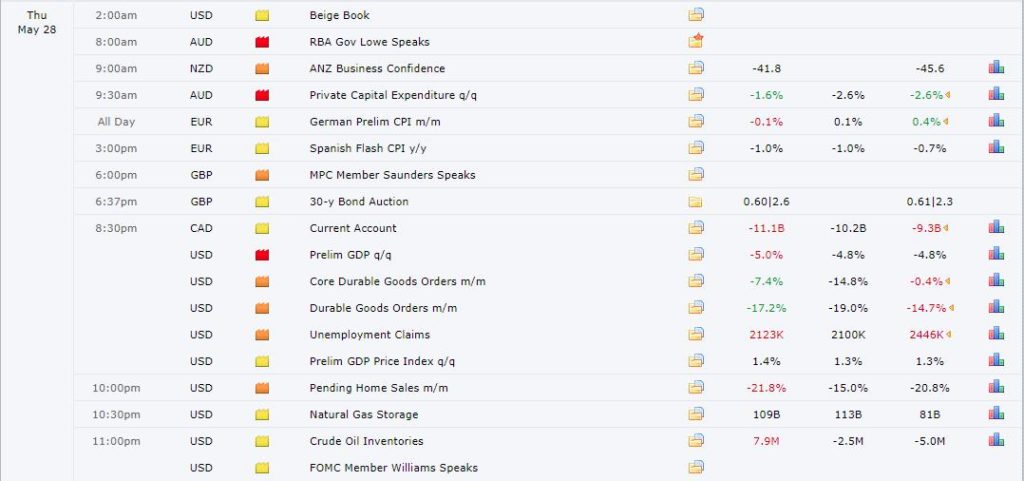
Heading into the late stages of Thursday, risk had been on a steady climb amid a sharp fall in US continuing jobless claims (V-shaped recovery anyone?) and renewed positive sentiment that the EU €750bn recovery fund proposal will eventually see the light. However, the gains were offset by a late-day setback in US equities after Trump announced that he will be giving a press conference about China on Friday.
The firm risk tone that had prevailed until then was dialed back in a move that rather than having connotations of panic is more about re-positioning as manifested by the calm fluctuations in the VIX (fear index). The jury is still out on what measures Trump may use to sanction China in response the country’s aggression against HK’s democratic right by inserting a controversial national security law.
If China, as many fear, use the law to make heavy-handed arrests, then for the U.S. “the long-term endgame could be the biggest disruption of the relationship since Tiananmen,” Derek Scissors, chief economist at China Beige Book and an AEI scholar, told MNI.
With the most pressing fundamental issues driving markets of the way, let’s now investigate the main takeaways in the charts.
- The S&P (NYSE:SPY) 500 continues to be well-anchored by the structure and momentum across both the 4-hour and daily time scales. The path of least resistance remains northbound and until technicals hint so, any correction lower is set to be transient in nature with active ‘buying on dips’ systematic strategies retaining the upper-hand.
- The bullish stance in US equities where the S&P 500 trades above 3,000.000, the recent breakout higher in a pair as risk-sensitive as the AUD/JPY or the resolutions into fresh bearish structures formed in USD-denominated pairs, all supports the notion that the prevailing dynamics are set to be a default view of buying risk.
- The follow-through demand anticipated in the EUR/USD after the first close above 1.10 in over 2 months played out like a charm as dip buyers emerged to take the market into new trend highs. This market is now on an active buy-side campaign with 1.1150 the next 100% proj target to be aiming for as the USD crumbles.
- Granted, GBP/USD is lagging way behind the EUR/USD, yet it also shows a predominant bullish bias with the daily and the 4-hour timeframes in agreement to expect further gains near term. There we no new Brexit/negative rates related headlines to take note of.
- By going through the AUD/USD and USD/CAD, even if the extend of the rallies against the USD were limited as caution settles in ahead of Trump’s measures against China, these are two markets where the trend remains very well established to see USDs. AUD/USD target a daily objective of 0.6720-50 (confluence of 100% proj moves) while 1.35-36 is the next goal for UC bears.
If you found this fundamental summary helpful, just click here to share it!
Insights Into Market Flows
This analysis is conducted on a multi timeframe dimension. Ultimately, it is the traders’ call, via a set of entries thoroughly backtested, to enter a position, hence the video is mainly intended as a way to educate traders in upping their analytical skills.
If you found the content valuable, give us a share by just clicking here! Besides, if you have a suggestion on extra instruments for me to cover, reach out to me via Twitter.
https://youtu.be/4AYCKMDfSX0
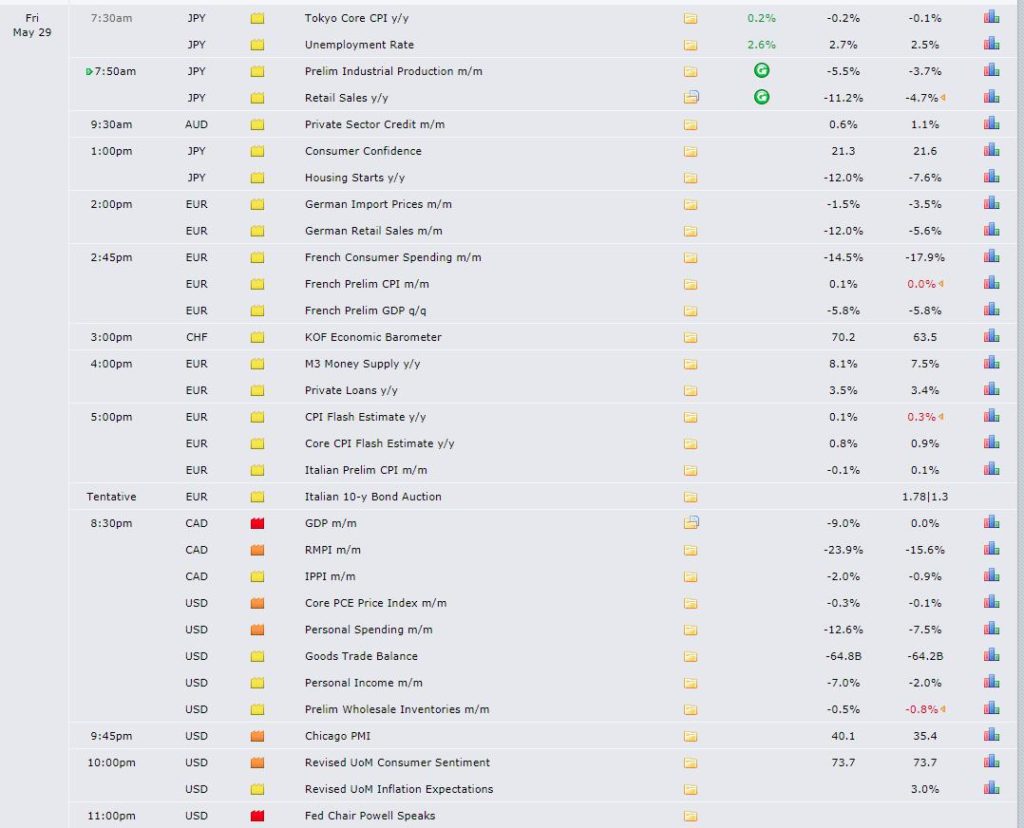
Recent Economic Indicators & Events Ahead

Source: Forexfactory
If interested in the best ‘free of charge’ News Indicator that displays data on past and future news in the Forex market via MT4, check this YouTube video I produced. The indicator allows you to save time, avoid mistakes. It’s spot on!
Important Footnotes
Markets evolve in cycles followed by a period of distribution and/or accumulation. To understand the principles applied in the assessment of market structures, refer to the tutorial How To Read Market Structures In Forex.
SMART MONEY TRACKER
In order to assess the market momentum of a particular asset, I’ve promoted for years the idea of using what I call the smart money tracker. The settings and the indicator can be obtained via our Discord room, where traders from all walks of life interact frequently. In this video I lay out the elements I look into to call trend directions.
SUPPORT & RESISTANCE
Unlike levels of dynamic support or resistance or more subjective measurements such as fibonacci retracements, pivot points, trendlines, or other forms of reactive areas, horizontal areas of support and resistance are universal concepts used by the majority of market participants. It, therefore, makes the areas the most widely followed. The Ultimate Guide To Identify Areas Of High Interest.
FUNDAMENTALS
It’s important to highlight that the daily market outlook provided in this report is subject to the impact of the fundamental news. Any unexpected news may cause the price to behave erratically in the short term. Monitor the event risks via Forexfactory.com & refer to Fundamentals vs Technicals In Forex.
PROJECTION TARGETS
The usefulness of the 100% projection resides in the symmetry and harmonic relationships of market cycles. By drawing a 100% projection, you can anticipate the area in the chart where some type of pause and potential reversals in price is likely to occur, due to 1. The side in control of the cycle takes profits 2. Counter-trend positions are added by contrarian players 3. These are price points where limit orders are set by market-makers. You can find out more by reading the tutorial on The Magical 100% Fibonacci Projection
