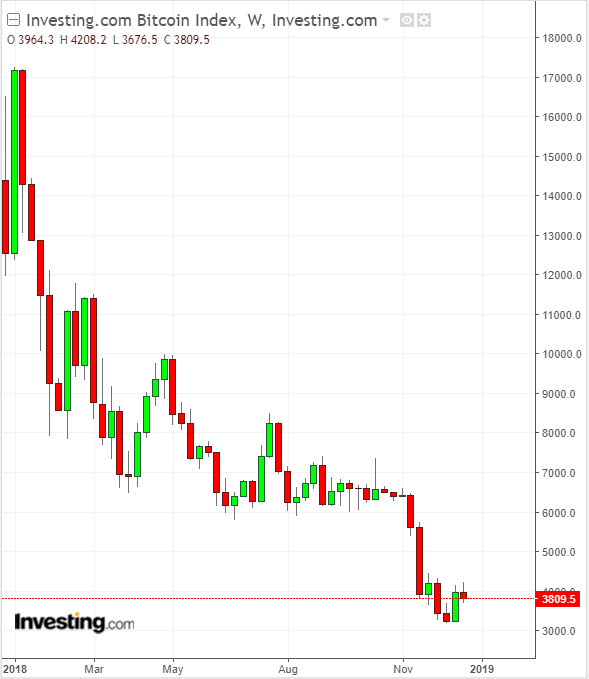
It was the year the bubble popped, with a resounding crash heard around the world. The entire asset class took a beating and no cryptocurrencies were spared.

Bitcoin—which started the year at $13,850, and is now trading around the $3,800 level—wasn't even the worst performer; it's down ‘only’ 80% from its all-time high (ATH) of nearly $20,000 reached on December 16, 2017. Ethereum, which began 2018 at $736 is down 91% from its all time high of $1,148, reached on January 13; it's now trading at $133.56 at time of writing. XRP? Down 89% from its January 4 ATH. Bitcoin Cash? Down 94% from its ATH reached on December 20, 2017. And those are just the most popular digital currencies by market cap.
As for volatility, once a signature characteristic of Bitcoin as well as the rest of the cryptocurrency market, Bitcoin’s profile changed radically over the course of 2018. During the first quarter, there were 36 days with price movements of 5% or more. In the second quarter, the number fell to 13 days where volatility hit 5%. In the third quarter: just 9 days with movement of 5% or more. Thus far during Q4 there have been 15 such days. It appears that Bitcoin breaking what seems to be a hard technical floor at $6,000 was behind the recent spike.
Perhaps more telling, over the past short month, Bitcoin has become less volatile than S&P 500. From October 16 to November 13 there were only 4 days when BTC’s daily movement was more than 1%; during the same timeframe, the S&P recorded 10 such days. Still, over the course of the year, the S&P recorded a grand total of zero days with 5% movement, versus Bitcoin’s 73. Even with the recent volatility spike, activity seems to be trending down, a classic side effect of a popped bubble.
'Fundamental' Signals Indicate Still-Healthy Ecosystem
A key 'fundamental' playing a role in both price and volatility is public interest, namely, how engaged investors are with Bitcoin and cryptocurrencies. According to Google Trends, search volume for ‘Bitcoin’ is down 88% since the token's December peak while searches for ‘Cryptocurrency’ are down 91%.
Though there may be no real consensus on what fundamental metrics are appropriate for Bitcoin and cryptocurrencies, the information above is a key statistic that could fit the bill. Other metrics signaling the health of the asset class include mining and nodes.
Mining is, and will remain, a major part of proof-of-work coins such as Bitcoin. Generally, the higher the mining power (hash rate) required to create new blocks, the more secure the network. As hash rates increase, so does the cost to disruptors of performing a 51% attack, decreasing the likelihood one will occur, thereby making the network more secure.
Bitcoin’s hash rate started the year at 13-15 TH/s, meaning miners were performing between 13 and 15 trillion calculations per second trying to find new blocks. In 2018, the hash rate peaked at 57 TH/s. Even as Bitcoin plunged to almost $3,000, hash rates never dropped below 32 TH/s. So regardless of the token's price, the raw power securing the Bitcoin blockchain at least doubled, even as the price fell by 80%, and even as miners' revenue shrank from over $40 million to just $6-7 million for the same amount of BTC.
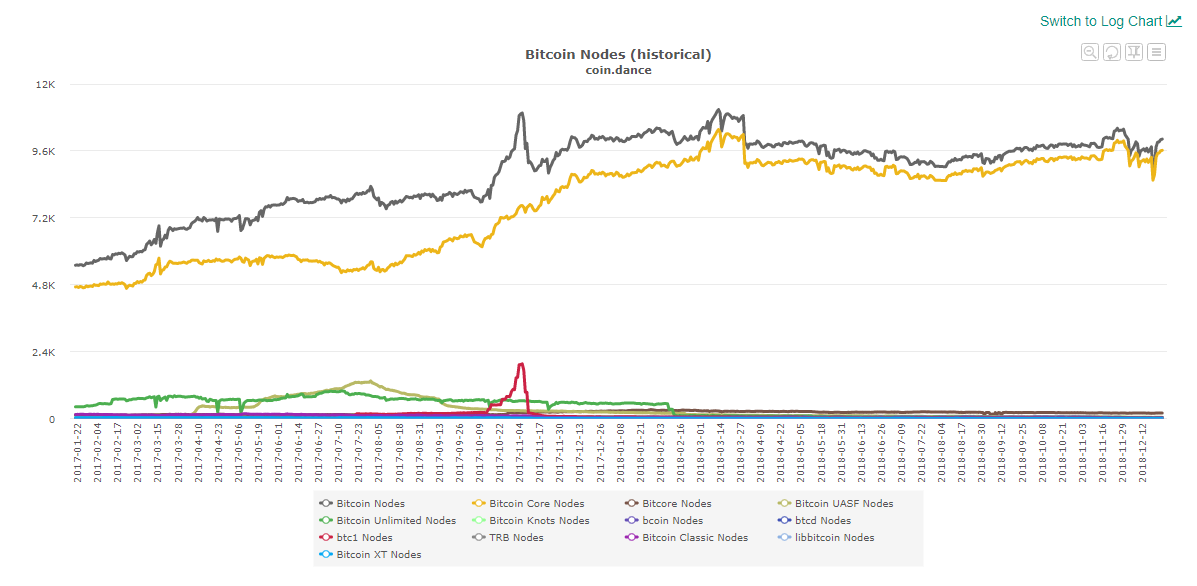
Bitcoin nodes are another indispensable part of the cryptocurrency's ecosystem. Nodes help validate and propagate blocks, keeping the network secure as much as miners do—if not more. Running a node is critical for checking every Bitcoin transaction. The number of full nodes is a good metric indicating Bitcoin ‘power users,’ and reflects the strength of the community.

Chart courtesy coin.dance
According to coin.dance, there were just over 10,000 bitcoin nodes at the beginning of 2018, and just below 10,000 nodes as of this week. In early 2017, during the nascent stages of last year’s boom, there were only about 5500 nodes on the network. So even though the price ballooned and then went bust, the Bitcoin network still gained a total of 4500 nodes. Thus, the boom added a significant number of power users, but the crash seems to have eliminated none.
Real transaction value tells a similar story. According to coinmetrics, the seven day average real transaction value of the Bitcoin network peaked at $14 billion dollars in late 2017 and sunk as low as $1.3 billion in December. At almost $20,000 per token during late 2017, that’s 700,000 BTC; now, at approximately $4000 apiece, that's 325,000 BTC today. Volume is clearly down, but still far from out.
Asset Pressured But Still Viable
Nevertheless, many crypto businesses have downscaled or shut down. Reportedly, 300 UK crypto businesses closed in 2018, and Consensys, a major Ethereum development studio, is said to be laying off at least half its workforce.
The US Securities and Exchange Commission (SEC) dropped a few hammers on crypto projects in the last quarter of the year and a few initial coin offerings (ICOs) settled charges of issuing unregistered securities. Still, 650 ICOs took place in 2018, up from 343 in 2017. As of the last few rulings, though, it seems every ICO carries potential regulatory risk.
Clearly, alt-currencies are under pressure, but the asset remains viable. Should investors heed the cryptosphere mantra of 'hang on for dear life' (HODL)? We're not convinced.
HODL is for ‘true believers’ indifferent to the price (perhaps 0.01% of the population). For everyone else, there's not necessarily a benefit to sticking with a bear market. Common sense investing applies.
Even if one recognizes the potential of cryptocurrencies—which we do—why not partially realize gains at higher prices and buy five times as many if the price falls? The classic investor strategy, adapted for the crypto age, still holds true. Don't let FOMO rule. Instead, keep a clear head and choose your bets wisely.
Clement Thibault is the host of Investing.com's weekly crypto podcast "Cryptalk," available on iTunes and Spotify
