The correction in crude oil has come as a shock to previously bullish traders and has rippled across global asset markets e.g. contributing to the selloff in the S&P 500 and the push lower in bond yields. So what's up (or down?) with crude, and what are the likely next steps from here?
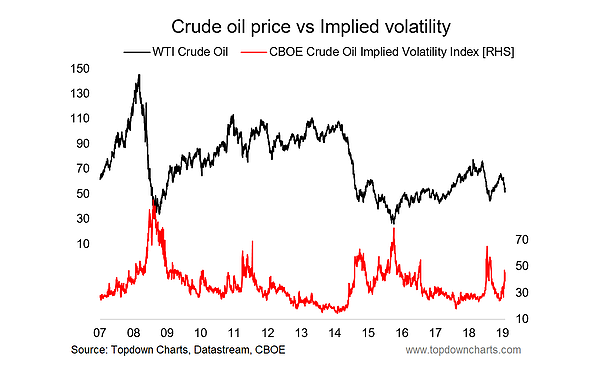
The chart in focus today comes from the latest Weekly Macro Themes report where I conducted an "oil check" after a solid selloff in WTI crude.
The chart shows the WTI crude oil price against the CBOE crude oil implied volatility index (OVX).

The reason for showing these two things in one chart should be obvious. Much like the signal that implied volatility (the VIX) provides for equities, the crude oil implied volatility index appears to act as a contrarian indicator.
Lulls and lows in crude oil implied volatility are seen more often at short-term market tops, and spikes in crude oil volatility are seen more often at market bottoms.
Indeed, right now we are seeing a classic contrarian bullish signal for crude oil. The crude oil volatility index has spiked significantly *and* has pulled back from the extreme. All else equal, the odds of at least a short-term bounce are high at this point.
It's also quite interesting to think about some of the other key factors for crude oil, for example, it was only a few weeks ago that the news/noise was focused on geopolitical risks like a potential imminent conflict between the US and Iran, or the civil tensions in Venezuela. The market clearly ignored these risks on the way down, but I think it would be wrong to forget about them completely, as while these risks might not necessarily materialize tomorrow, they remain simmering in the background—and there should be some risk premium.
The other aspect, as I alluded to at the start is that traders were very bullish on crude (crowded speculative net-long futures positioning). This has been shaken out at least partially now.
Add to that a return of positive seasonality in the next couple of months, and a potentially weaker U.S. dollar (thanks Fed!), and then this little implied volatility signal starts to look very interesting indeed.
While these indicators can fail (e.g. crude oil volatility could go higher yet we'd see another push lower in the oil price), it is certainly worth a closer look—and even if you can't trade oil directly, I would suggest you consider the ways oil can indirectly impact other assets as this signal plays through.
