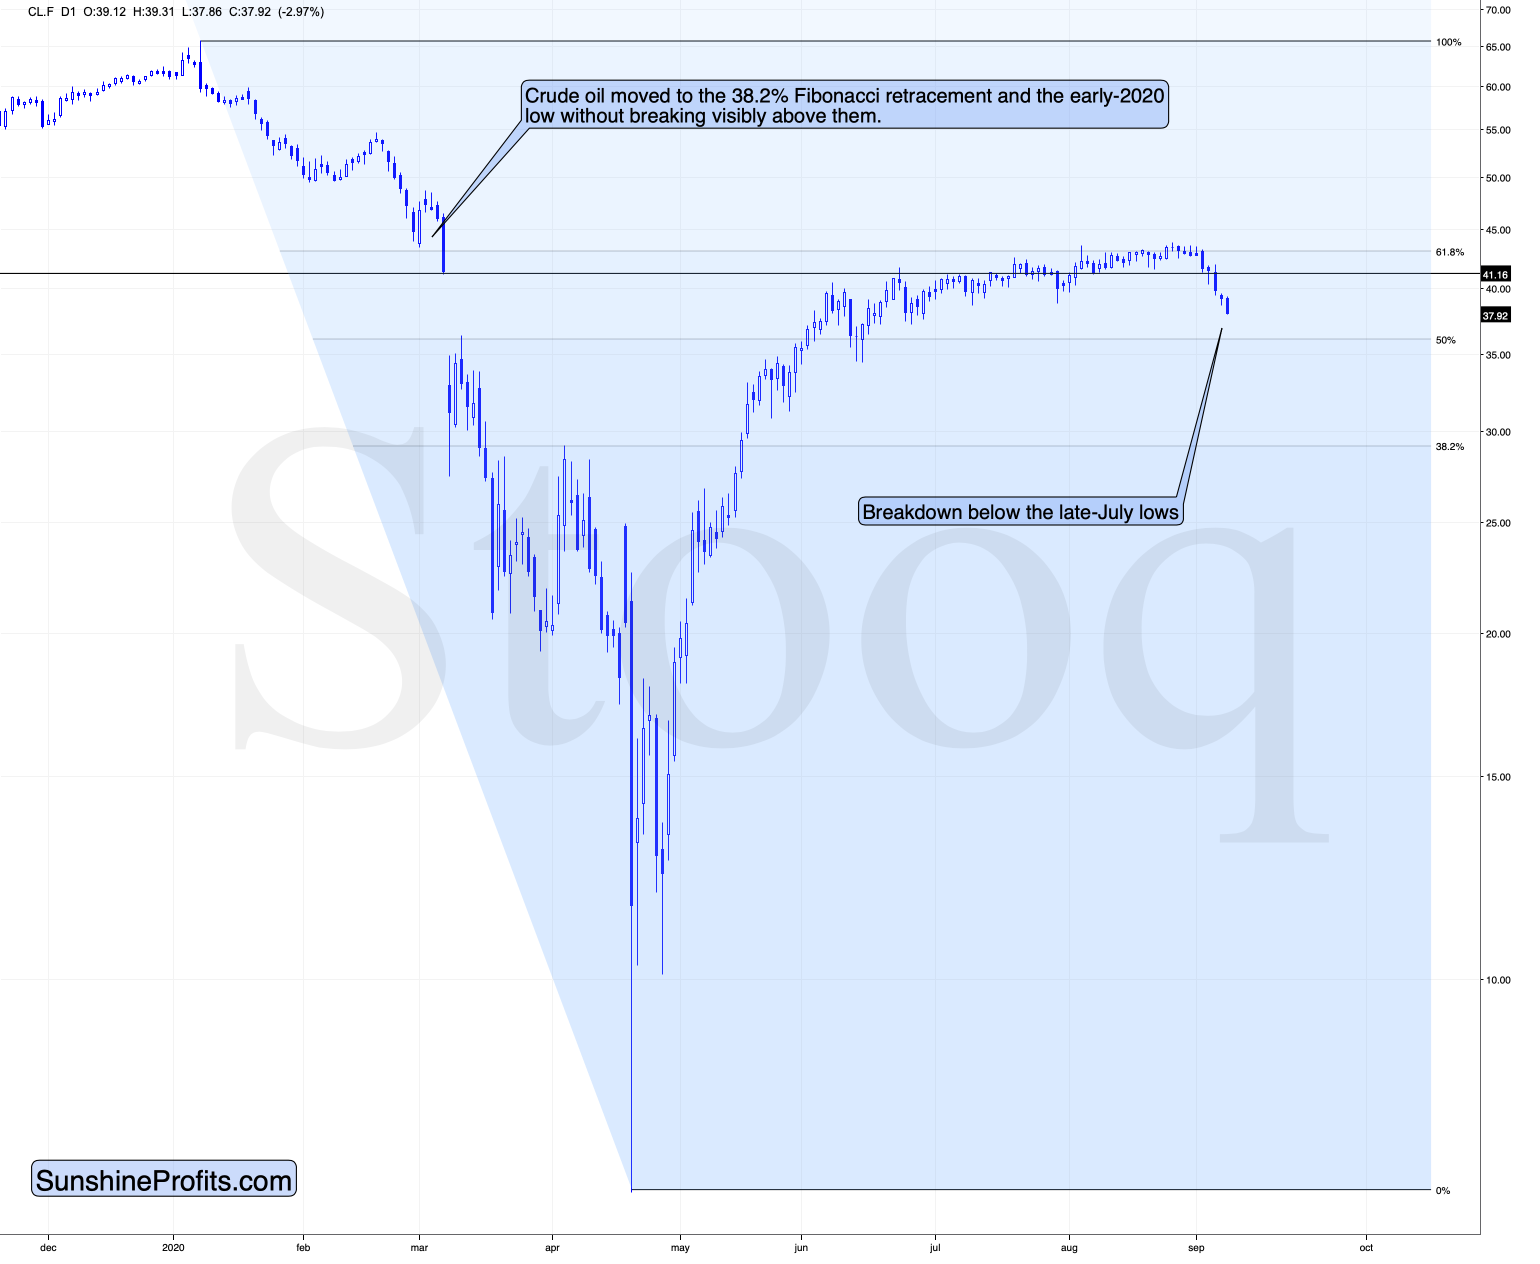
Crude oil declined quite substantially this week, and it doesn't look that the decline will be over just yet.
After a given market clearly moves in a certain direction, corrective moves are bound to happen. After all, no market can move in a straight line up or down. But still, this assumption might be misleading in case of the current situation in black gold. Obviously, it is taking a breather right now after declining several dollars. But, that doesn't mean that any sizeable rebound is going to happen.
As a matter of fact, based on how crude oil behaved before the decline, we believe that it's going to slide even further.
In today's globalized and interconnected economy, no market moves completely independently from the rest of the world. Crude oil, as the most versatile commodity in the market, is definitely not an exception.
Two of the markets that it often looks up to are stocks and currencies.
Rising stocks are bullish for crude oil, due to better-performing companies that drive greater products demand and transportation. Directly or indirectly, crude oil is used in many of those processes.
Conversely, a rising USD Index is bearish for crude oil (at least from the USD point of view), because that's the currency crude oil is priced in.
The USD Index is after a short-term breakout, and the S&P 500 has just moved below its previous 2020 high, nullifying its breakout. This bodes very well for our profitable short positions in crude oil, but it's not the most bearish signal available right now.
Arguably, the most bearish indicator is that crude oil declined even before the above-mentioned USDX strength and general stock market weakness occurred. Even though the USD Index had been declining and the S&P 500 had been rallying previously, crude oil refused to rally based on these indications.
Let's take a look at the crude oil chart for details.

In early June, instead of rallying, crude oil kind of stopped with its significant growth. Since then, it has consolidated (mostly) below the 61.8% Fibonacci retracement level based on the previous 2020 decline and below the early-2020 low. As a result, the black gold had already shown a significant weakness for weeks, a decline completely not surprising given the above.
As such, crude oil was very vulnerable to the bearish stock market or bullish USD Index signals. And now, it just received both of them.
Technically, crude oil corrected to the 61.8% Fibonacci retracement, and now, it is declining once again. The strong resistance stayed on, and consequently, the price turned south.
To us, it seems very unlikely that crude oil would refuse to genuinely rally for months (! - since the June top), and decline by only a few dollars. Undoubtedly, it declined a few dollars, but only as a response to tiny USDX and general stock market moves. As these moves continue, crude oil is likely to amplify them, just like what it's been doing for the past week.
