Two months ago in our Sector/Commodities Sentiment extremes report we noted that a “popular delusion” could be taking place in the most important commodity on the planet. We made the case at the time that crude oil was due for a rally and that rally could be good for stocks.
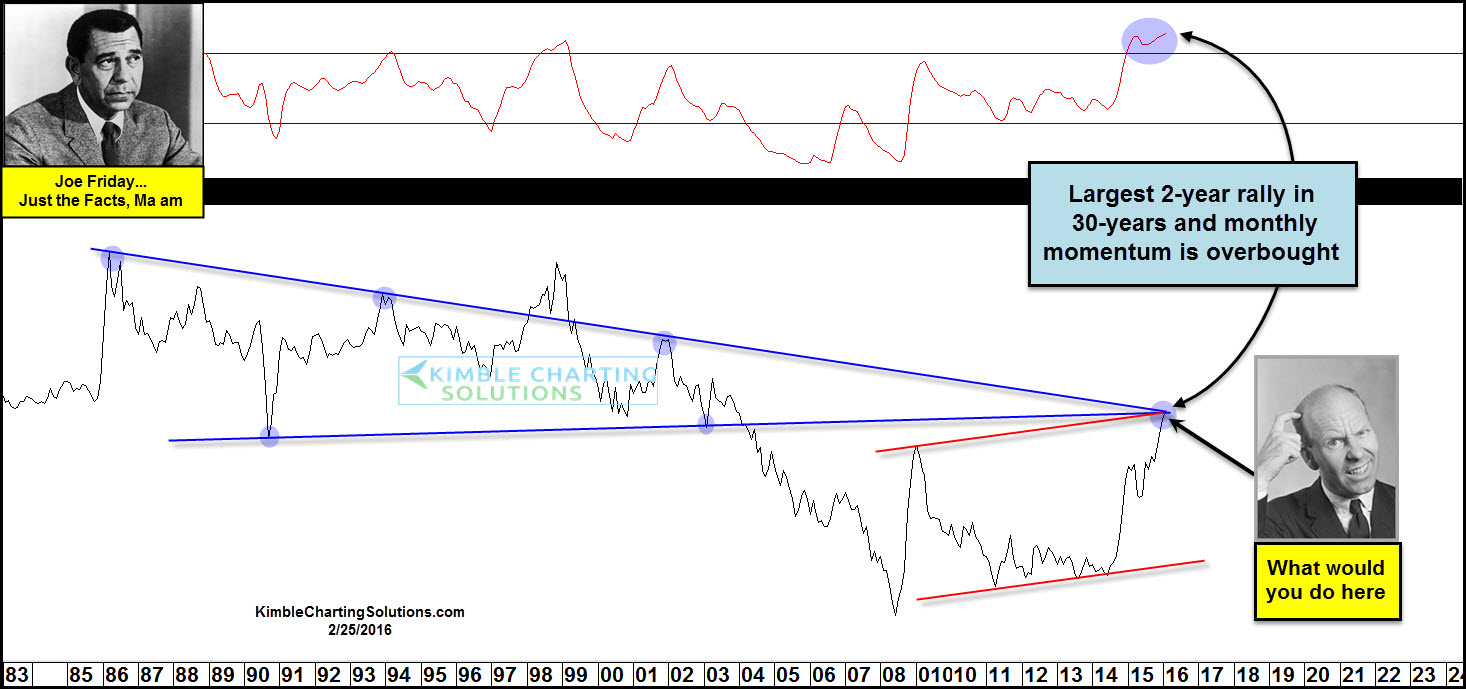
On February 25 we shared the chart below, showing that crude had just experienced its largest 2-year rally ever and that momentum looked to be overbought. What would you have done with the chart back in February?
So what would you have done at this price point? The monthly chart was inverted (turned upside down). We made the case with Premium Members that crude oil looked to be on support and that a rally in crude might just be good for stocks. A couple of days later, members shorted the Fear index, purchasing (NASDAQ:XIV). The following month, stocks had a good rally and XIV screamed higher, moving up 31% on the month.
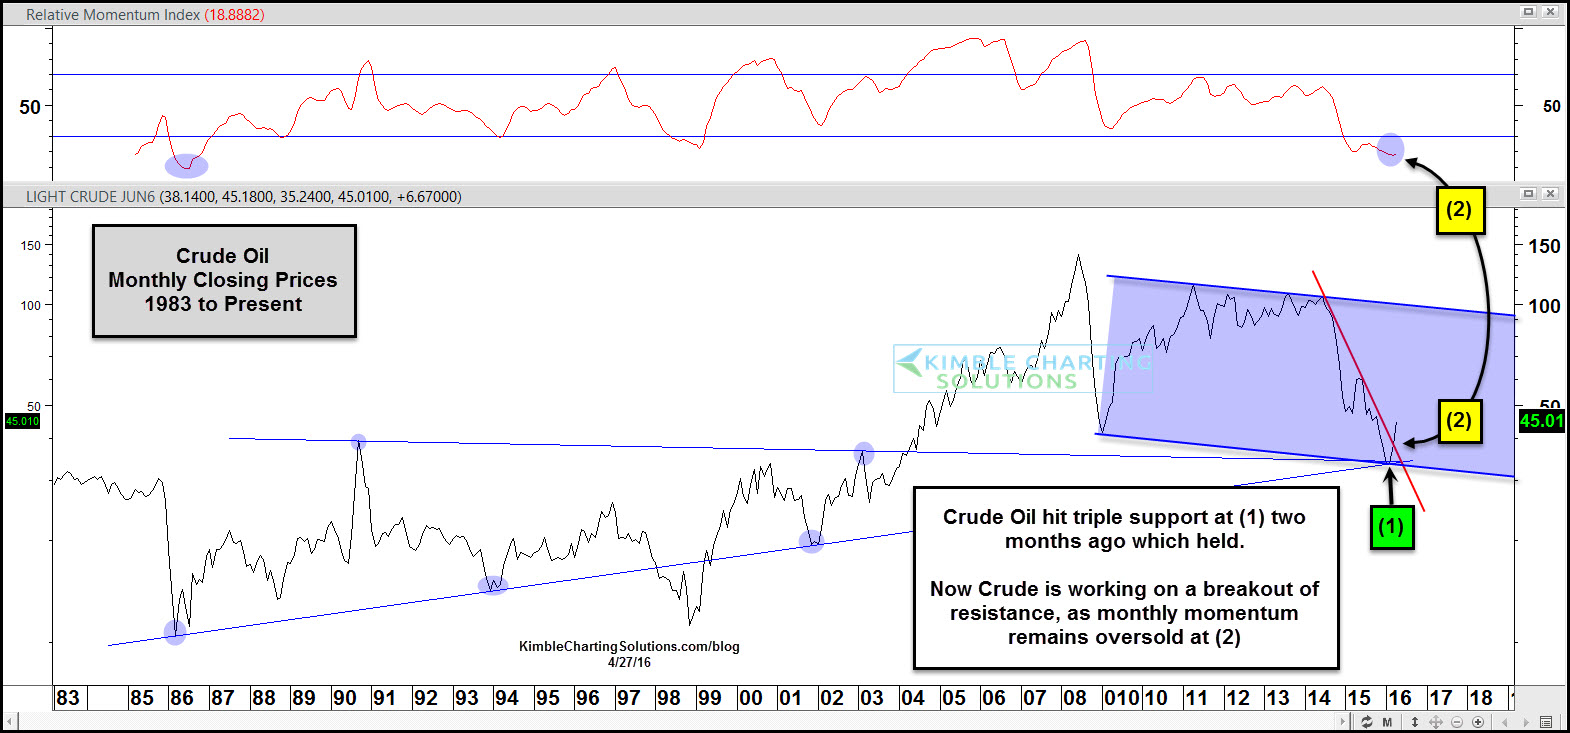
Below is an update on the February chart.

Crude oil's monthly closing hit triple support at (1) two months ago when it was trading near $30 a barrel. Since then, crude has rallied nearly 50% in 60 days. Now crude oil is breaking above falling resistance while monthly momentum remains oversold at (2) above.
The Power of the Pattern felt like a 'popular delusion' was taking place then as way too many people were bearish crude oil. As mentioned above, while crude looked to be presenting an opportunity to make money in oil and stocks in general, we still feel that crude oil will be a big driver of stocks going forward.

