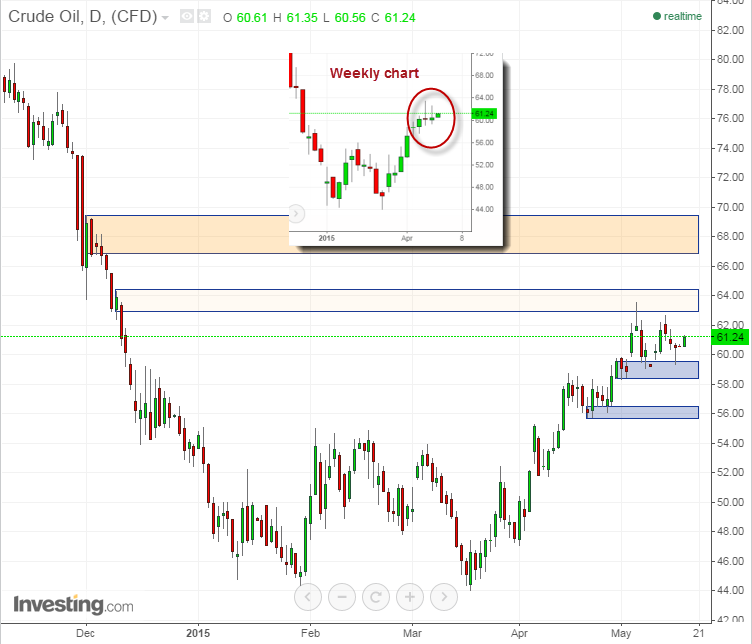
Crude Oil experienced another week of hesitation last week, closing on Friday with an even smaller weekly candle while lingering between daily supply and demand zones. It even stayed between daily exponential moving averages (EMA), 200 above and 144 below.
The trend still remains bullish, in particular as long as the US dollar remains bearish. Not much has changed since last week's analysis, but the bears' failure to complete the potential head-and-shoulders bearish pattern on the 4-hour chart implies that the bulls were still somewhat in control, though not very much, as the indecisive weekly candles suggest.
We recommend waiting for Crude Oil to move out of its sideways range before taking action in either direction.
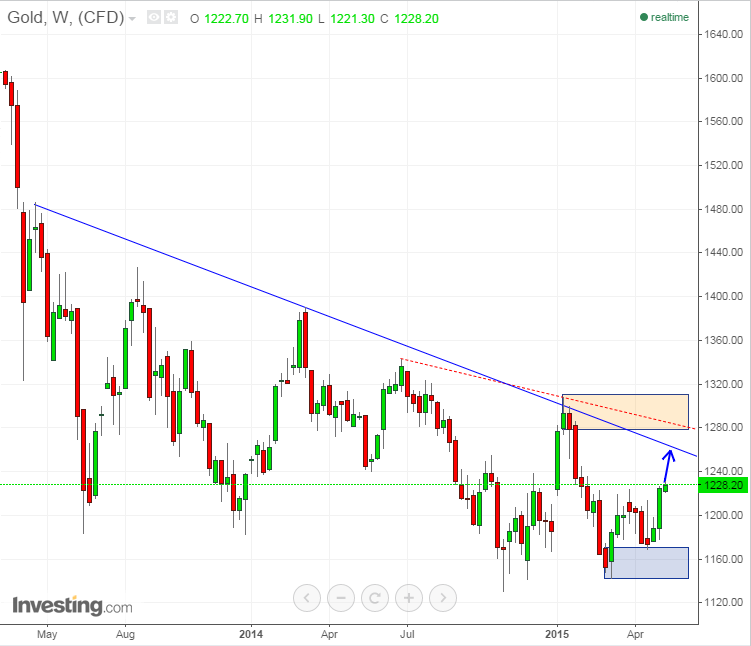
The yellow metal saw some decent gains last week after a couple of months of indecision. On the weekly chart we can clearly see a bullish reversal pattern on top of the weekly demand zone. Since last November, it seems as if Gold has been forming a solid base. Could this be the ongoing accumulation that would be part of the long-term monthly falling wedge? Time will tell.
Along with the downtrend-line (the top of the wedge), there is a weekly supply zone as well as another trend-line, serving as potential strong resistance for bulls. The weekly supply zone is found between $1275 and 1310, just above the falling wedge's upper trend-line.
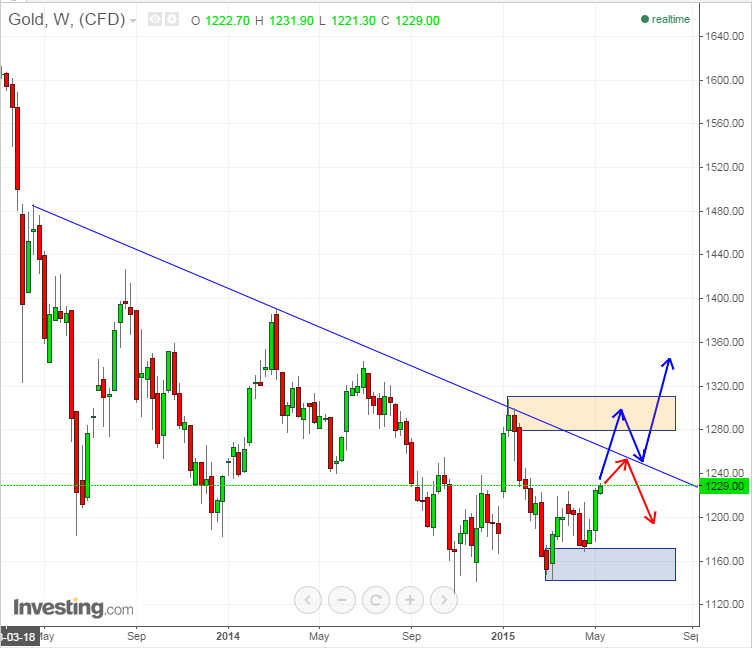
Two possible scenarios for Gold include moving up to find sellers at the supply zone or one of the downtrend-lines around $1260 (red arrows below), then moving down again. Alternatively, it could move up and breach the trend-lines, re-testing them and moving up yet more, consuming the supply zone too (blue arrows.) Remember that we're talking about the weekly chart, so these moves can take several weeks.
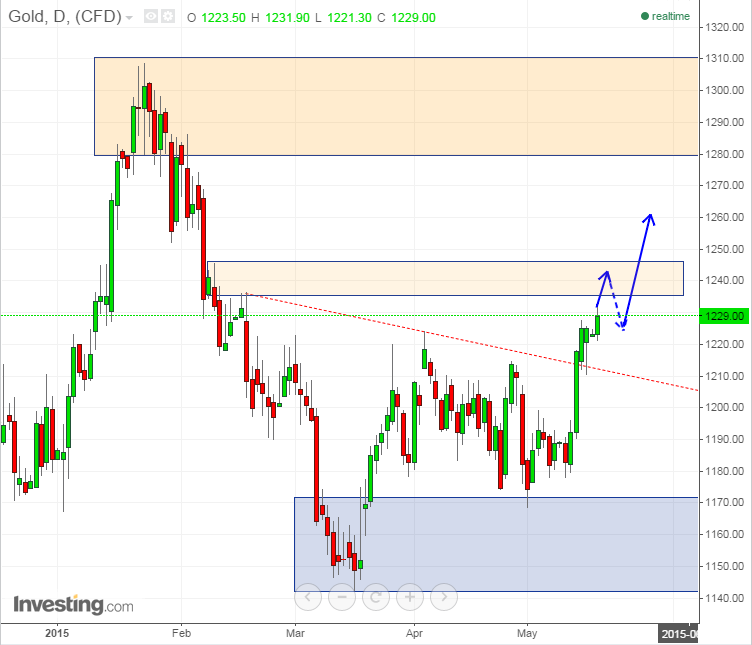
In the meantime, on the daily chart, the price has breached a trend-line and is moving toward a small daily supply zone, after which the weekly supply awaits. A retest of the trend-line will afford a nice opportunity to go long with a stop-loss below the daily candle's low (around 1200-1210), an initial target at the daily supply zone (1235-1245), and a second target at the above-mentioned weekly supply zone or trend-lines (1280-1290.)
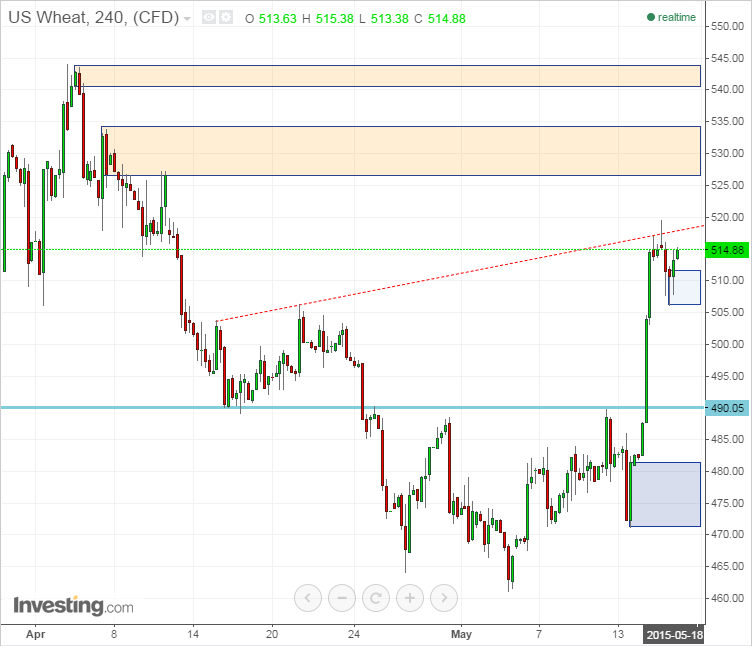
A few words about US Wheat, which gained almost 6% last week, after pushing higher from the monthly trend-line. There is yet more room for an up-move, but if you are looking to go long, you will get a better risk:reward ratio if you wait for the commodity to go down a bit, towards a support line around 489, or in the area of the freshly-formed demand zone at 506-511.
