Crude Oil: The Coming Week's Potential Scenarios
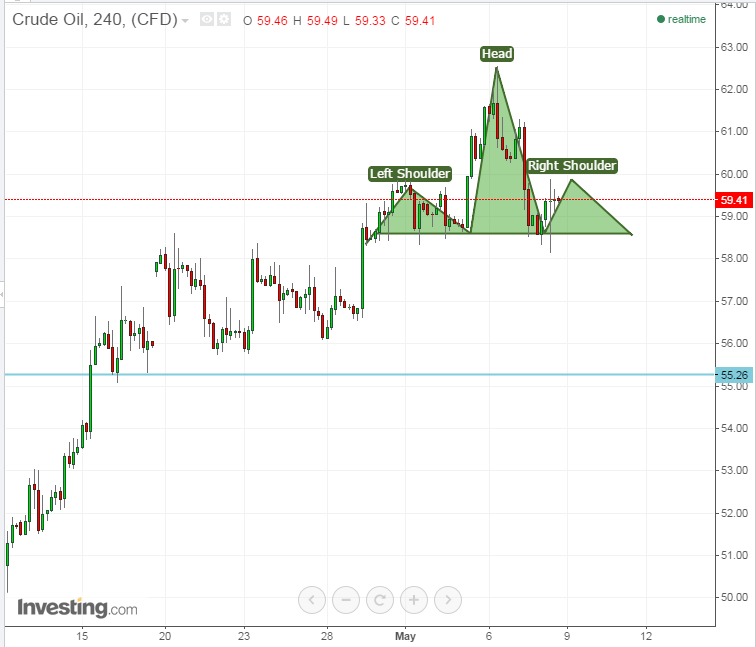
Last week was hectic for the Crude Oil, which fired up during the early part of the week, but stopped at the confluence of a small daily supply zone and the 200-day moving average. After forming a beautiful hourly head-and-shoulders pattern, it dropped and created a bearish shooting star.
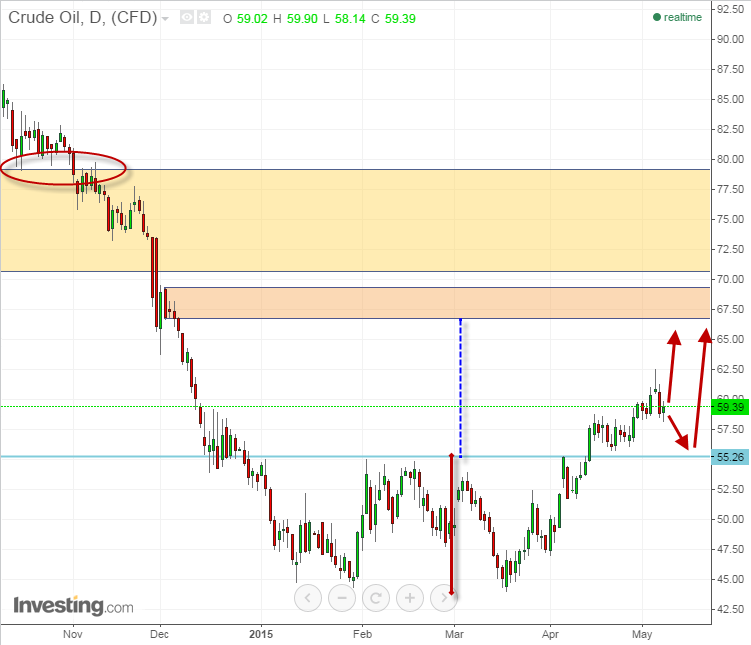
Ultimately, last week's candle closed as a doji, but this does not necessarily mean a bearish reversal, as long as there is no confirmation. Should the bears gain control this coming week, they're expected to meet the bulls at support around $53.60 at the double bottom's neckline or lower at the potential monthly demand zone between $50-$55.
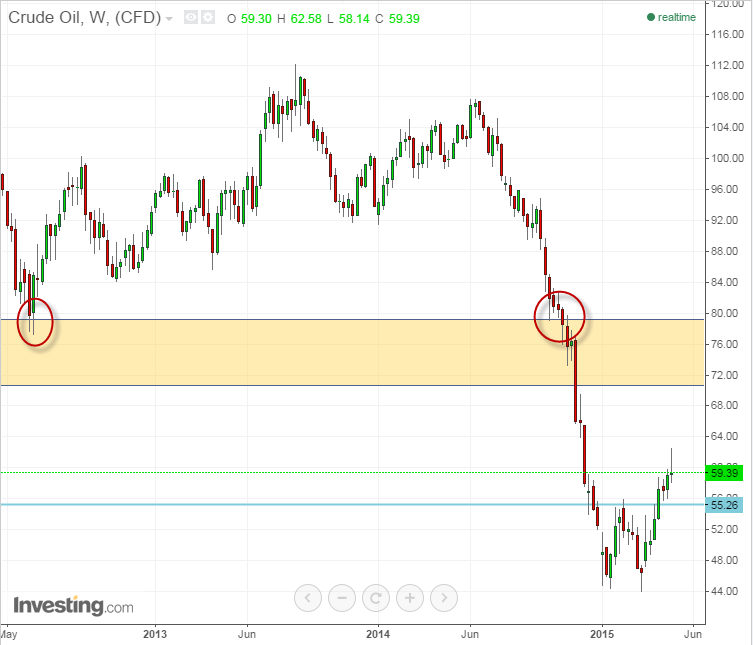
If these levels hold and the chart continues its move up, the next significant daily supply zone resides around $66, which is also the projection of the double bottom height ($11) from its neckline ($55). Just above, there's a great wall in the form of a broken demand zone, which might turn into a supply zone, as mentioned last week.
On the daily chart we are forecasting two possible scenarios for an eventually-bullish move for the crude oil. The first: crude oil keeps moving up from last week's close; The second: there is an initial move down towards the neckline of the double bottom before another up move. Other scenarios include breaking the neckline and moving even further down, in which case we will have to re-analyze the chart accordingly.
In case the second scenario plays out, we might see another head-and-shoulders pattern forming in the 4-hour chart. The pattern's neckline is around $58.50, which gives the pattern a total height of $4 and a target of $54.50, just around the neckline of the double bottom.
This week's Crude Oil events include:
- API Weekly Crude Stock on Tuesday, May 12
- Crude Oil Inventories on Wednesday, May 13
Note that all the levels and zones depicted above might vary slightly from chart to chart according to your chart's platform and quote provider.
US Wheat: Going Green?
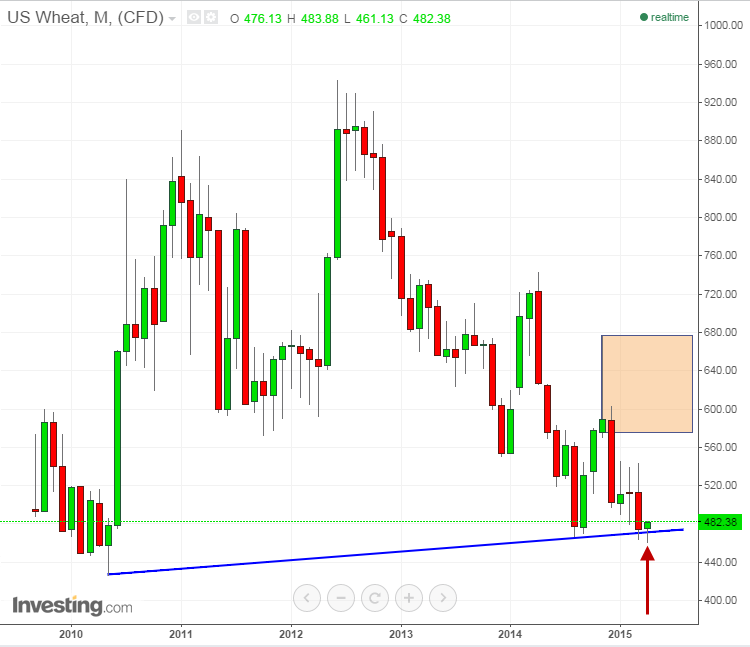
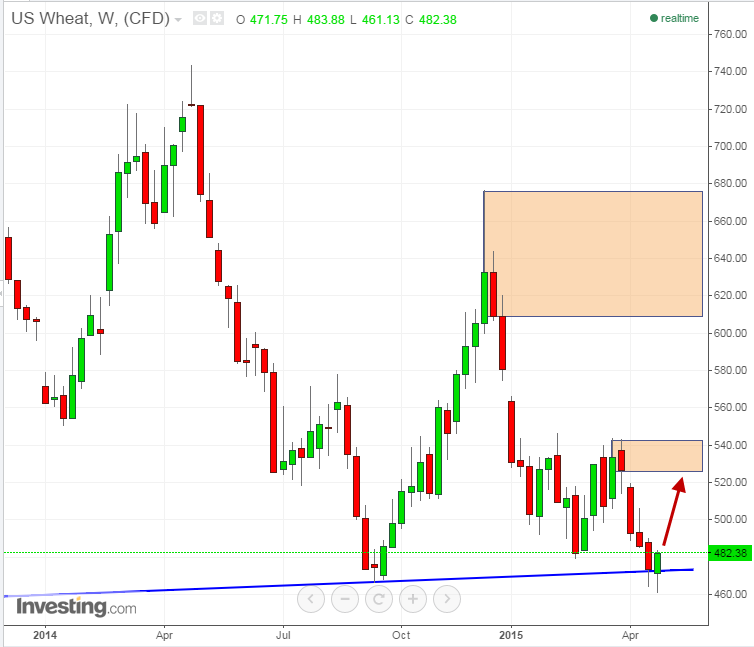
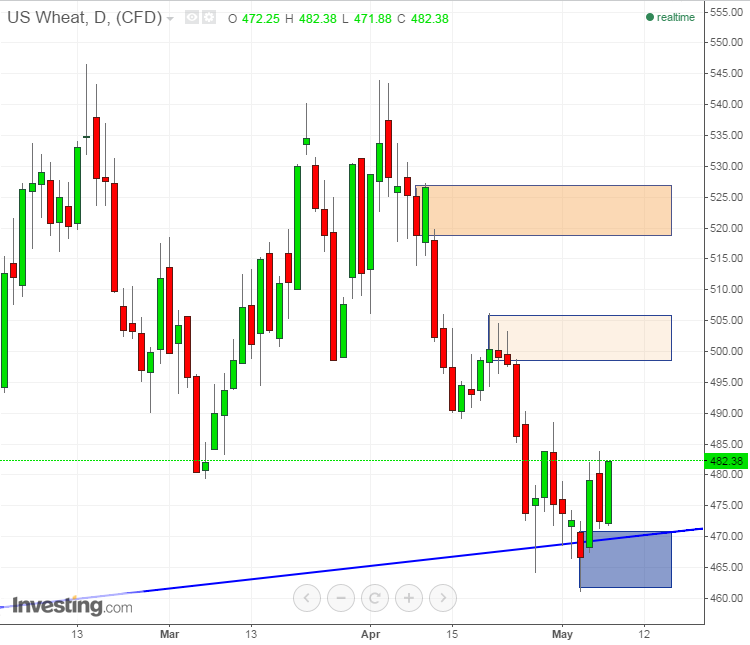
Seems like the US Wheat chart has found some support around a fresh, rising trend-line on the monthly chart. The weekly and daily charts also show some bullish activity with long lower wicks on the former and bullish engulfs and fresh demand zone on the latter. If this grain pushes higher, it may reach daily and weekly supply zones around $5.19 and $5.25 per bushel respectively. If the trend-line breaks, US Wheat prices could drop all the way to the weekly demand zone of $4.40.
US Dollar Index Still Bearish
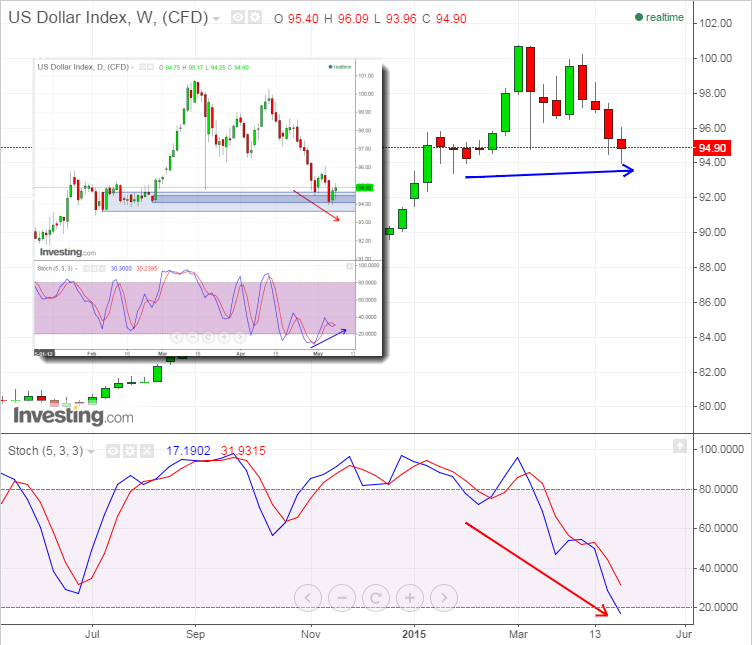
After retesting the broken trend-line, the US Dollar Index dropped again to the daily demand zone, completely consuming an inner demand zone (the darker, thinner rectangle within the uppermost daily demand zone on the chart below). From here the dollar could retest the trend-line and then breach it or drop again, or consume the current demand zone without even going up much more, again. After three straight weeks of heavy losses, last week saw some hesitance, but declines may resume faster than expected if the daily zone is consumed.
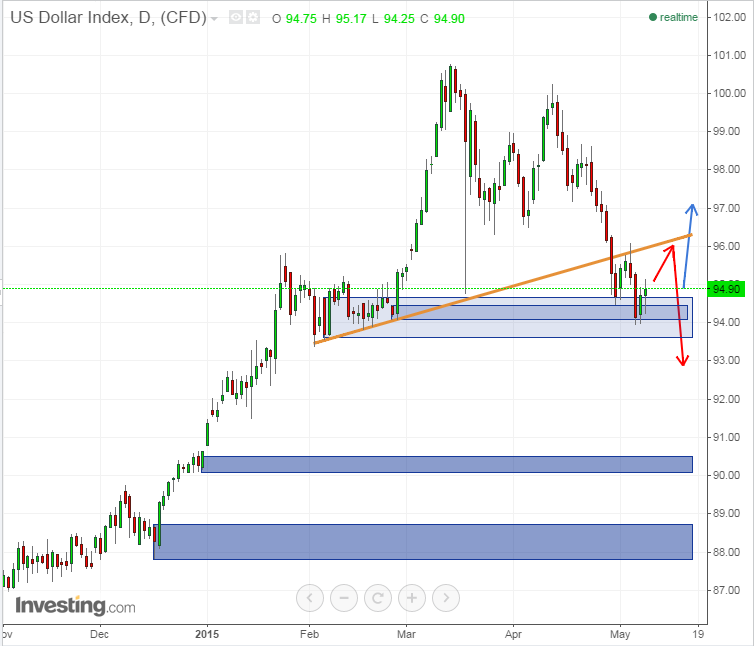
That being said, the stochastic indicator on the daily chart is forming a potential bullish divergence, and on the weekly chart, the oscillator is almost over-sold, and relative to the previous troughs it is forming a hidden bullish divergence (in which the troughs are higher or at the same level as preceding troughs, but the oscillators are much lower, even over-sold, indicating a possible uptrend resumption.) The hidden divergence will be confirmed only when the oscillator turns up above the over-sold area, but since this is a lagging indicator, it will happen only after noticeable gains. However, if the price keeps going down, there is no limit on the oscillator to keep going lower.
