Investing.com’s stocks of the week
Summary
The yield curve hasn't moved much in the last six weeks.
While the corporate market has moved out in absolute terms since the first of the year, the spread to the corresponding treasury is still contained.
The futures market is predicting a 25 basis point rate hike.
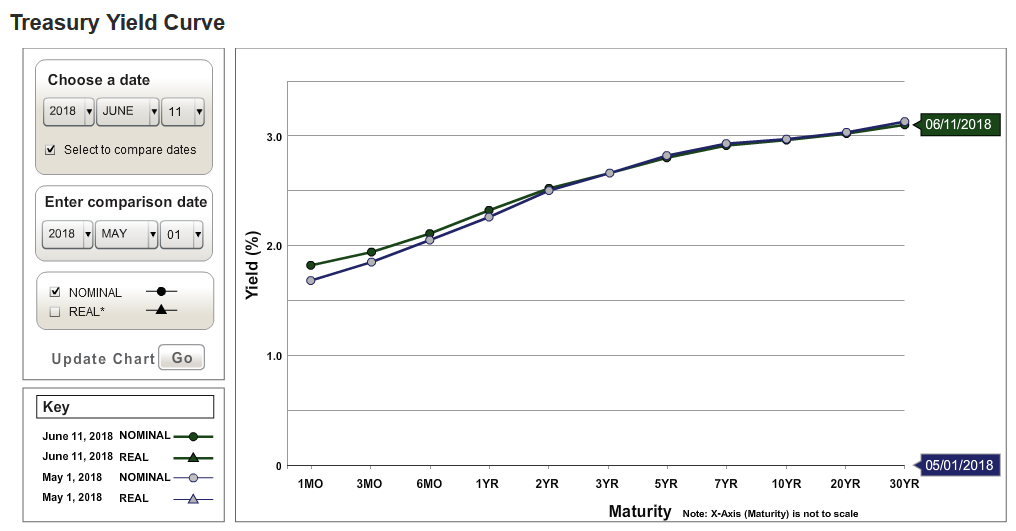
The yield curve hasn't meaningfully moved over the last 5-6 weeks.
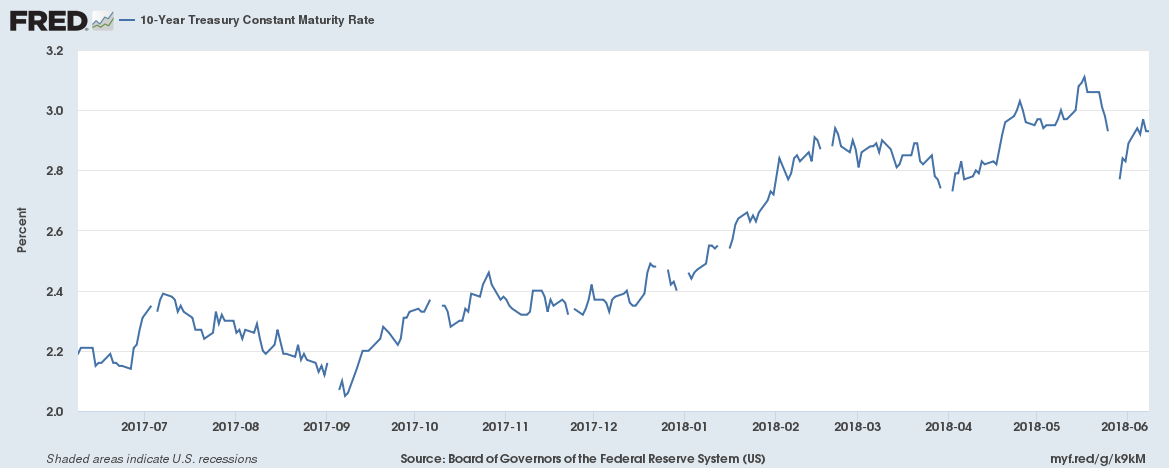
The chart of the 10-year CMT's yield shows this in perhaps better detail. Yields rose to about 3% at the beginning of May. They briefly moved higher but then sold-off a touch, hitting the 2.8% level. They're now approaching 3% again. But compare this movement to that in early 2018 when yields rose a little over 40 basis points. Movement since then looks more contained (please see this article explaining why yields are probably contained around the 3% level).
Turning to the corporate market, here's a chart of the various maturities' yields:
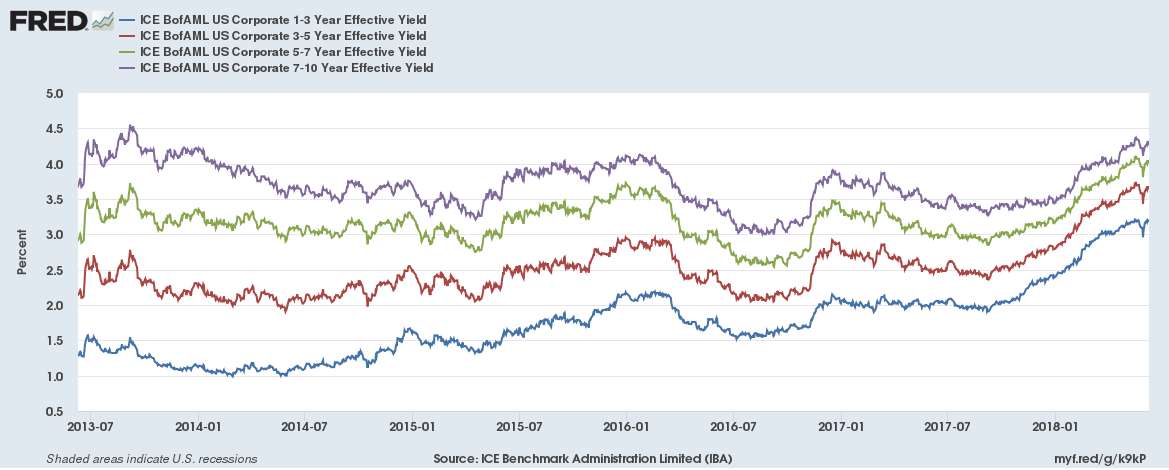
The above chart breaks the corporate sector down into the 1-3, 3-5, 5-7 and 7-10 area. We've seen a widening since the first of the year in all maturities. However, should we be worried about this? Maybe. On one hand, we've seen some pretty large moves from a basis point perspective. For example, the 7-10 year area has widened by nearly 100 basis points while the 1-3 year area is up nearly 150 basis points. From a fixed-income perspective, these are some pretty large moves.
But ...
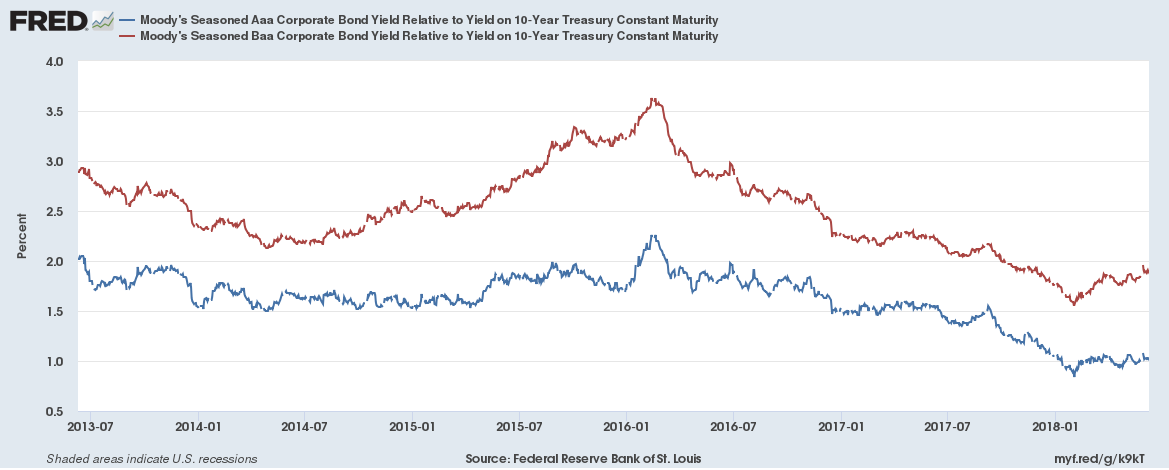
The AAA and BBB spread relative to the corresponding 10-year has widened but by a far smaller amount.
To piece this information together from the corporate sector, the top chart could simply show that the corporate market repriced risk at the beginning of the year. This would go hand-in-hand with the Fed taking a more aggressive view towards rates which was, in turn, based on higher potential GDP growth (it was at this time that Fed governors started talking about the economy having the "wind at its back," due to increased federal spending, lower taxes, and a more bullish international environment). However, the Treasury market also rose during this time, which explains why the actual corporate-Treasury spread rose at a slower pace.
Turning to the inflation picture, here are two charts of the Y/Y percentage change in the PCE price index:
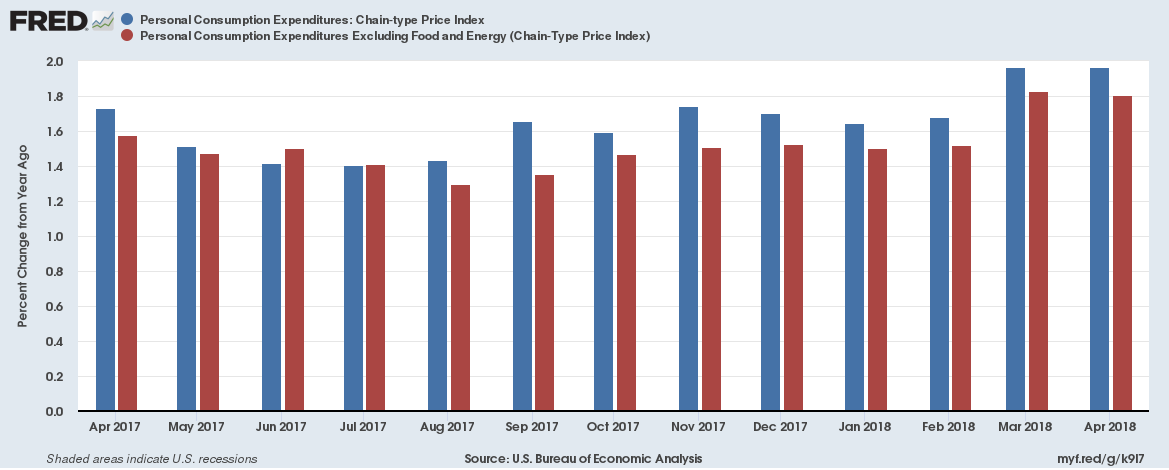
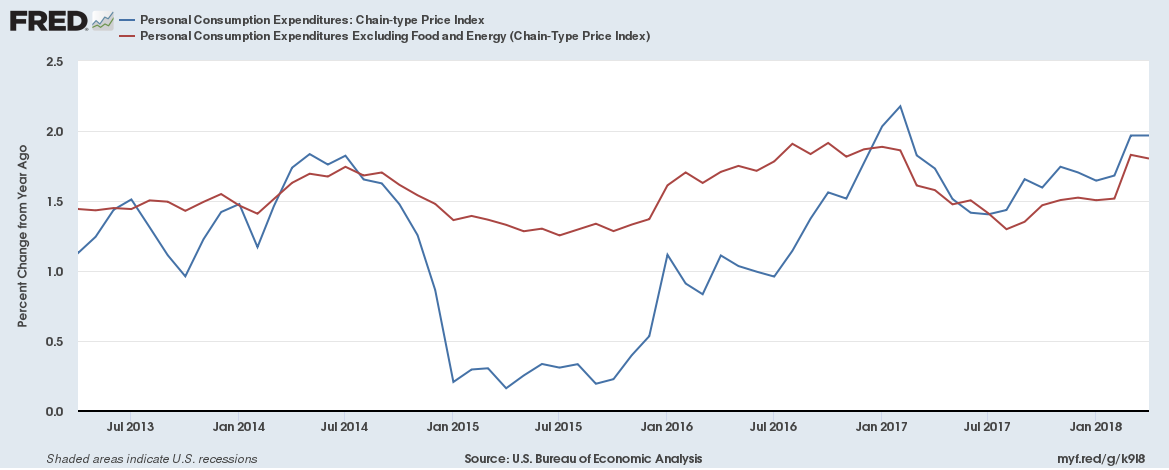
First off, remember that the Fed's 2% inflation target is symmetrical -prices can be above 2% and below it (I mention this because the market seems to treat this level as a ceiling, and it's not).
The top chart shows the last year's data for the Y/Y percentage change. Price levels have been inching up towards the Fed's 2% level. The bottom chart places this information into a longer historical context. It shows that prices have been contained for the last five years; they've barely threatened the 2% level over the last 60 months.
A big reason PCE price levels area contained is that inflation expectations are also mild:
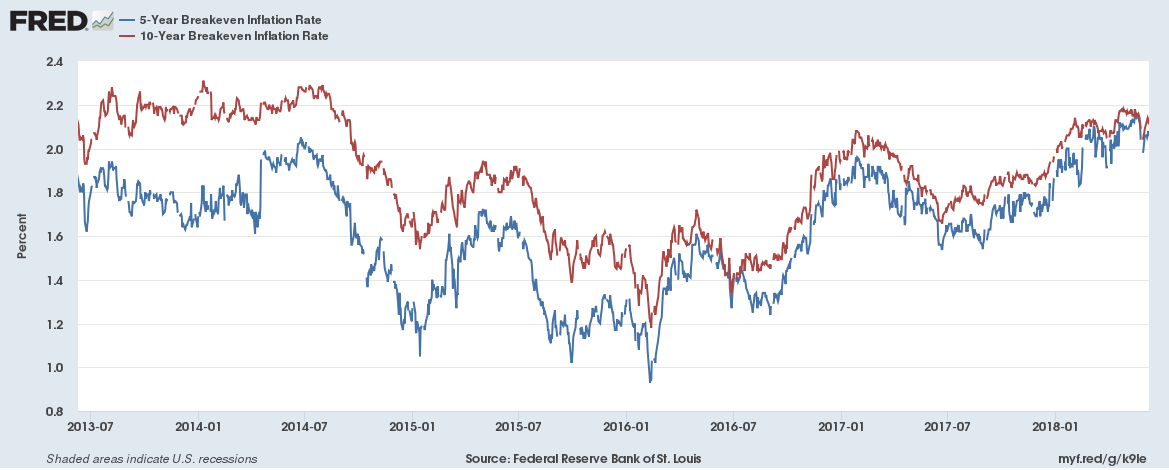
The above chart shows the five-year results for the 5 and 10-year inflation expectations, which are a large component of the term structure of interest rates. It's only been this year when both moved over the 2% level. The 10-year rate briefly rose above 2% at the beginning of 2017 but quickly moved lower.
Finally, what will happen at Wednesday's meeting? According to the investing.com interest rate projection tool:
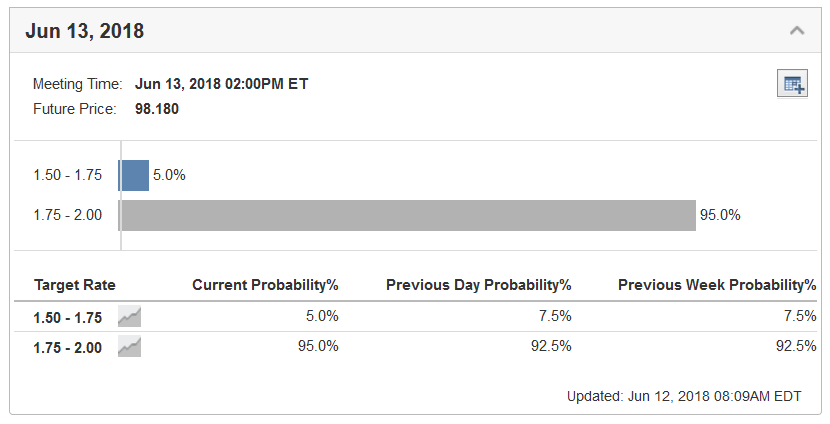
We'll see a 25 basis point hike.
Disclosure:I/we have no positions in any stocks mentioned, and no plans to initiate any positions within the next 72 hours.
I wrote this article myself, and it expresses my own opinions. I am not receiving compensation for it (other than from Seeking Alpha). I have no business relationship with any company whose stock is mentioned in this article.
