The equity market likes nice round numbers. That's why, when prices move through key levels like 25,000, the headlines erupt in euphoria. The same is true for the bond market.
For example, right now everyone is talking about the 3% yield on the on 10-year Treasury, asking and pontificating if and when the market will broach this key level, and, if yields do move through 3%, how high they'll go. But this discussion misses the point. The real question is this: if the 10-year hits this key level, will we see a major advance beyond 3%? The answer to that is most likely no.
The reason is based on the structure of interest rates—that is, what exactly are interest rates made of? There are several factors, starting with the "natural rate of interest." This is a theoretical construct; it's the level at which rates will neither inhibit nor promote growth. Analysis by now NY Federal Reserve President John Williams shows that the natural rate of interest is very low for three reasons:
Changes in demographics affect r-star on a number of levels. We are living longer: Over the past three decades, life expectancy in developed economies has risen by nearly five years and is expected to keep rising.5 When people expect to live longer, they tend to save more for retirement, and this increased saving puts downward pressure on interest rates.6
Despite the fact that we're living longer, labor force growth in the United States has actually slowed, largely due to baby boomers retiring and a lower fertility rate. In fact, the labor force is forecast to grow just ½ percent per year over the next decade, well below past trends.7 Fewer people joining the labor force means fewer people working, producing, and consuming things, which leads to slower growth and less investment, which in turn drives r-star down.
The same thing is true of productivity growth, which has also slowed compared with earlier decades.8 In the 1990s and early 2000s, the explosion of the internet and computing power led to annual productivity gains averaging 2 to 3 percent. Productivity gains since the recession have generally hovered around 1 percent. I have a sneaking suspicion it's because we're using all that technology to play Candy Crush, instead of increasing productivity! But I don't have the data to back that up.
The third and final factor holding down r-star is the high global demand for safe assets we've seen develop over the past two decades. This has driven down the returns on Treasury securities and safe short-term loans relative to those on riskier assets like corporate bonds and equities, and thereby depressed r-star
(For those interested, there are a number of research briefs at the San Francisco Federal Reserve on this topic).
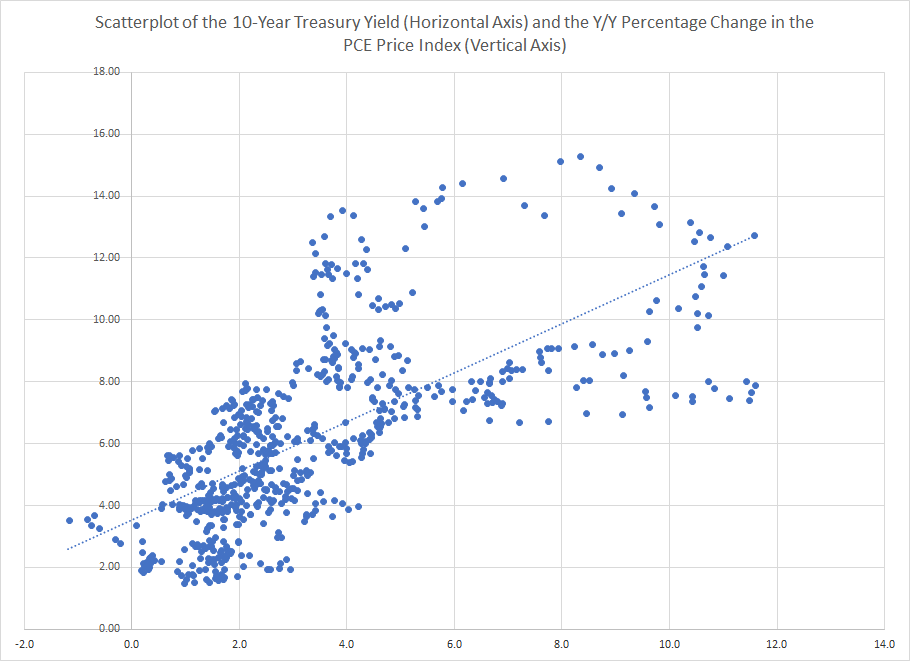
Inflation is the second component of interest rates. Because it covers a wider range of prices, the Fed's preferred inflation measure is the PCE price index. The following scatterplot diagram shows the correlation between the 10-year Treasury yield (horizontal axis) and the Y/Y percentage change in the PCE price index (vertical axis):
(data from the St. Louis Federal Reserve; author's calculations)
The diagonal line is the linear regression line derived using the least squares method, which shows a positive correlation between these two variables. The actual correlation between these two numbers is .68, which is very high. This chart shows that the two numbers are statistically related to one another. This does not mean that one causes the other, only that they are likely to occur at the same time. But, assuming that inflation remains contained, we can also assume that interest rates will follow suit.
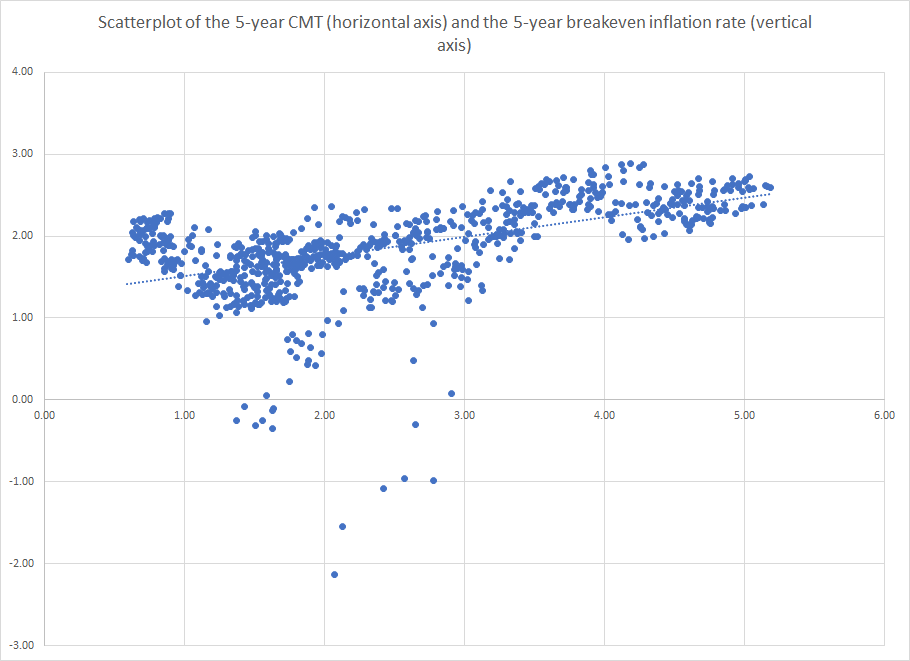
Inflation expectations (as measured by the difference between the 5-year CMT and 5-year TIP) are the third component of interest rates. Here is a scatterplot of those two variables:

(data from the St. Louis Federal Reserve; author's calculations)
The horizontal axis is the 10-year yield going back to 2002 while the vertical axis plots the 5-year breakeven inflation rate for the same time period. To keep the amount data manageable, I'm using weekly numbers. The vertical line again uses the least squares calculation method. The actual correlation is .52; still positive but lower than the level seen in the PCE/10-year yield correlation. However, the level indicates the two occur at the same time. So long as inflation expectations remain contained there is no reason to think we'll see a spike in interest rates.
To conclude, there are three economic events that are currently keeping interest rates low:
- The low level of r*
- The low level of PCE inflation
- The low level of inflation expectations
So long as inflation and inflation expectations remain contained, there is no reason to think we'll see a spike in interest rates. And that's why, should rates move through 3%, we shouldn't worry about an impending interest rate spike.

