
Today, the S&P 500 is trading around 4220. However, it already reached 4219 on April 29. Hence, almost zero progress over a month, other than:
A) pop to 4236 on May 10,
B) a drop to 4057 on May 12,
C) back to breakeven today.
It's quite the mess, isn’t it. Luckily using the Elliott Wave Principle (EWP), one can see there’s a method to the madness. See Figure 1 below, showing the hourly chart for the SPX.
Figure 1: S&P 500 hourly chart with detailed EWP count
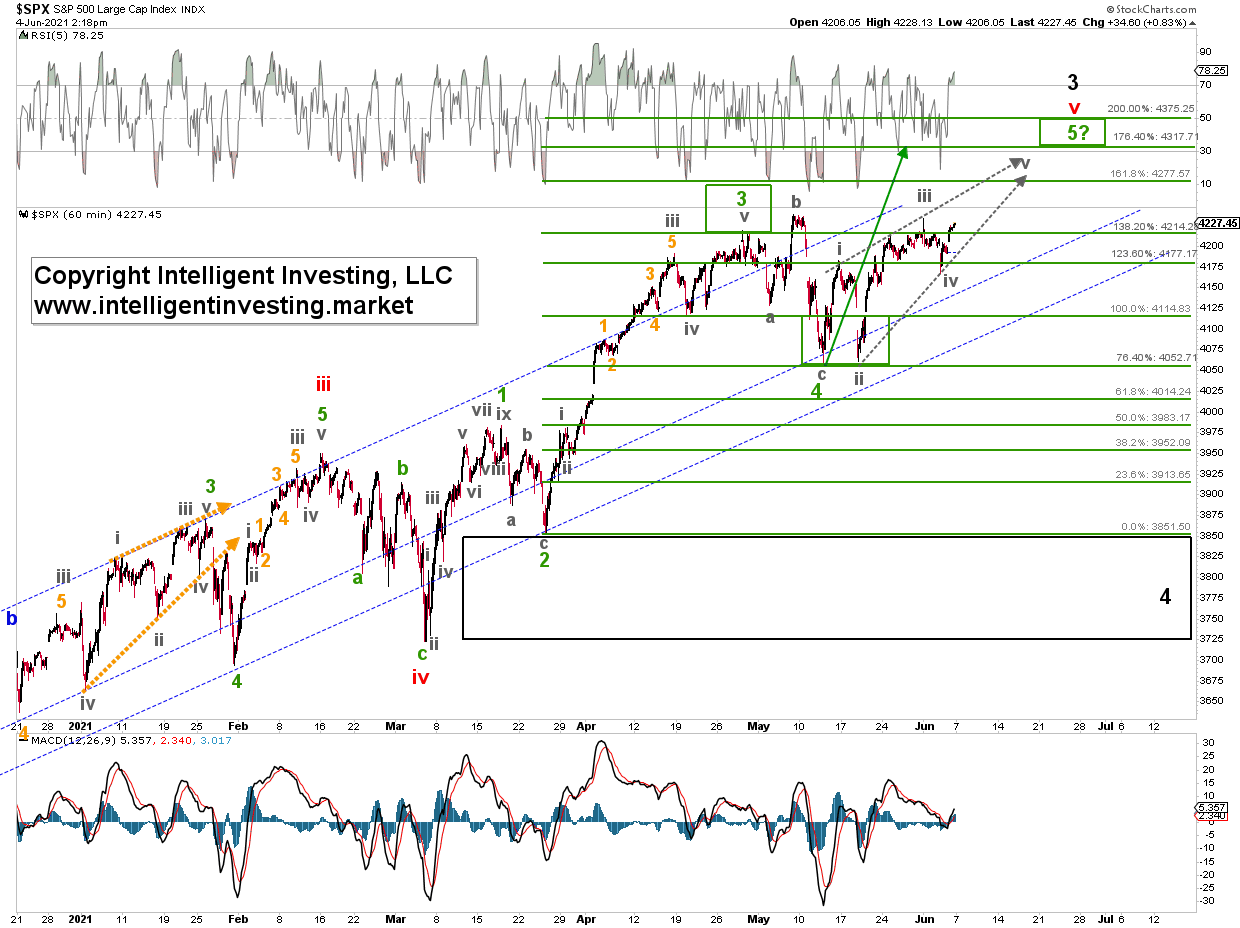
Namely, the early March low rally is progressing in five (green) waves, i.e., an impulse wave. As you can see in Figure 1, (green minor) waves 1, 2, 3, 4 completed, and wave-5 should now be under way. Third waves typically top at around the 138.2 to 161.8% Fibonacci-extension of the entire length of wave-1, measure from the wave-2 low. That happened on April 29 as the 138.20% extension sits at 4214 and the index topped, as said, at 4219. We know with 100% certainty that after wave three come waves four and five in an impulse wave. Fourth waves tend to bottom at around the 76.40 to 100% Fib-extension of wave-1, in this case, 4053-4115. The low on May 12 low at 4056 was thus wave-4. In turn, this means wave-5 is now under way.
Fifth waves typically target the 176.4 to 200.0% Fib-extension of wave-1, which reside at 4318-4375. Unfortunately, the May 12 low rally overlapped as yesterday’s low at 4168 dropped below the May 14 high at 4183. This pattern strongly suggests the index completes an ending diagonal (ED, green minor) 5th wave (grey minute waves-i, ii, iii, iv, and v). EDs are pretty tricky patterns, as they overlap. The internal waves themselves consist of smaller waves that travel in threes instead of non-overlapping five-wave sequences. Please compare the current pattern with that of the first few weeks of this year (orange arrows).
Note that once a diagonal completes, the price will move quickly to where the diagonal started, just like the index did in late January. Thus, once this ED ends at around 4275-4375 to complete (black) major wave-3 with an ideal target of 4350+/-25p, we should expect a shift decline back to where it all started: 4050 for major wave-4, which could even drop as low as 3725-3850. From there, I anticipate another push higher to new all-time highs. As such, please keep the upside reward versus downside risk in mind per your preferred trading time frame(s).