Closing at fresh one-month highs, Treasury yields bounced sharply through Wednesday's session after falling in broad market weakness throughout much of January and early February.
Reacting to Monday's better than expected US economic data that found the ISM Manufacturing Index contracting at a slower pace than the previous month - and construction spending exceeding analysts estimates, investors shunned the safe haven shores of Treasuries to wade deeper into the torrid retracement rallies in equities and oil now extending well into their third week of consecutive gains.
Looking back, after the Fed’s rate hike last December failed to elicit another tantrum in yields, hysterics simply translated market anxieties downstream - this time in the higher echelons of risk in the equity and commodity markets that invariably created significant demand for Treasuries as investors quickly ducked for cover.
When the dust settled in the second week of February, 10-year yields had collapsed below the lows from January 2015 and dropped beneath underlying support extending from the cycle lows in July 2012.
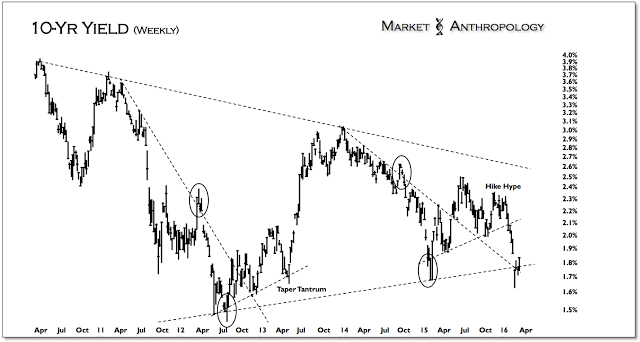
Although after this week’s large sell-off in Treasuries the 10-Year yield now sits above longer-term support; more importantly, where yields had a clear opportunity and catalyst to break out above long-term resistance coming into this year, market forces once again arose and overwhelmed conditions needed to generate that potential and exceedingly elusive outcome.
Consequently, our opinion today is that despite a likely interim high for Treasuries in February that could extend a pause through the spring, yields should find significant resistance over the course of this year, as the US equity cycle continues to turn down, maintaining a bid in Treasuries and underlying anxieties that a more significant downturn is underway.
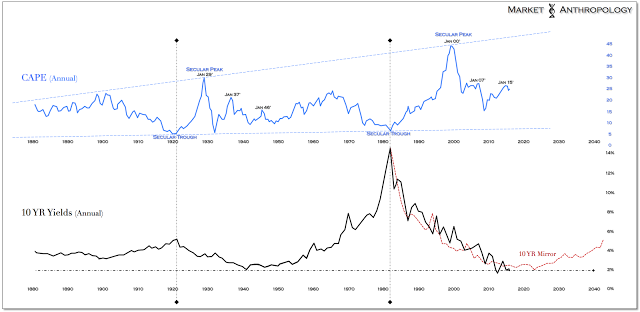
All things considered, we defer to the broader long-term cyclical patterns in CAPE and yields that has pointed towards a revaluation in equities lower and a prolonged market environment of historically low yields.
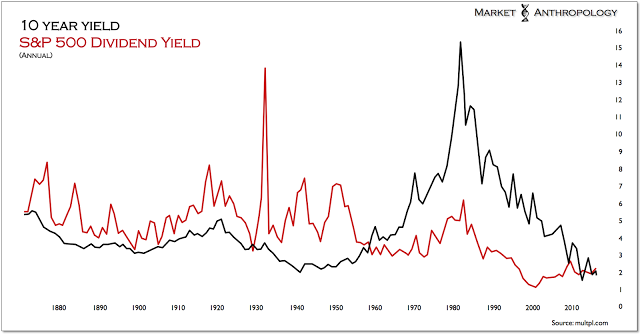
As we first mentioned last year, this would manifest with a sea change in the markets where the dividend yield of the S&P 500 could remain elevated above the 10-year yield for the foreseeable future. For long-term investors, reinvesting dividends of high quality and high yielding stocks remains a prudent approach, as we expect the spread between these two benchmarks to continue to widen from the shift witnessed last year.
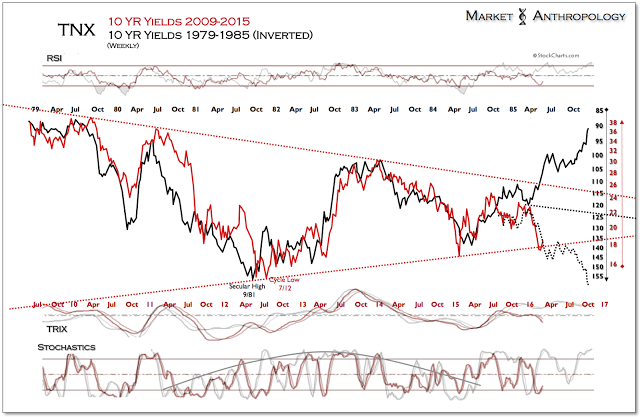
While we’ve followed it more out of curiosity than anything else, what’s interesting to note is that as yields were making an attempt last summer at testing long-term overhead resistance, the inverted cycle comparative that we’ve followed over the past two years and which has been surprisingly prescient towards the path of yields, broke form and is now following the actual structure and momentum pivots of the long-term break down in yields in 1985. Remarkably, the break below support this February occurred right where the comparative had indicated a break out. Assuming this theoretical shift loosely maintains pattern, the 10-year yield would break below the 2012 lows around this fall.
When it comes to other alternative investment approaches during the next phase of this unique market environment, we continue to believe that commodities will benefit again as nominal yields remain suppressed while another pulse of inflation moves through the system. And just as investors shunned the risk in the late 1940’s that inflation would erode real returns in fixed income, we expect participants greater fears of a more pernicious downturn in the economy and equity markets to largely support Treasuries - despite rising prices and our own expectations that the downturn in the markets will be relatively modest (versus 2007 and 2000) and the economy muddles through.
The takeaway once again for participants is that real yields should move lower, which historically is when commodities have realized their greatest returns. Gold, which has been the best performer since the December rate hike and which in the past has led the commodity complex out of their respective lows, continues to lead the broader move. 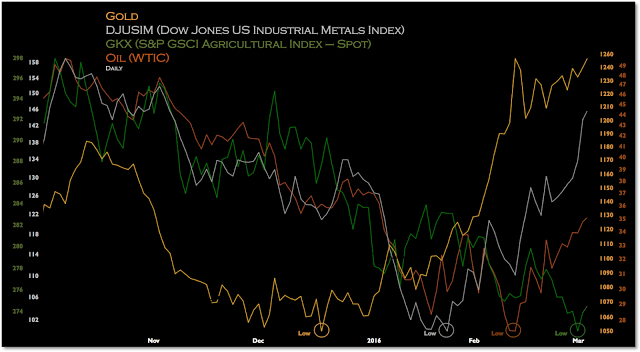
And while we expect gold to take a breather over the short-term, a greater breadth of performance in the commodity sector should continue to widen as industrial metals, energy and agricultural prices move out of their respective and successive lows - and as the US dollar turns down.
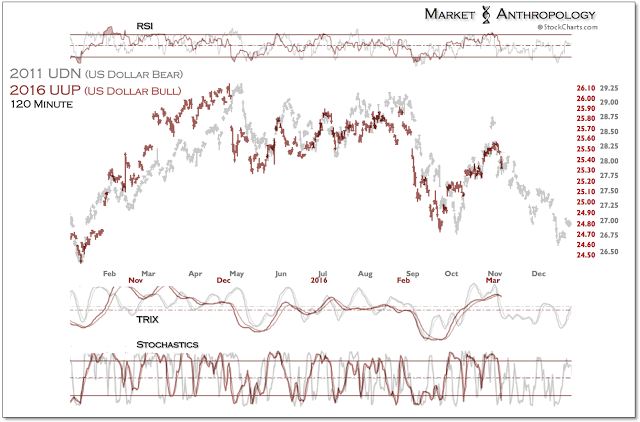
Although the dollar's retracement rally extended a bit further than our expectations last week, the next stair down appears underway, as the dollar index follows the inverse pivot away from its cyclical highs.
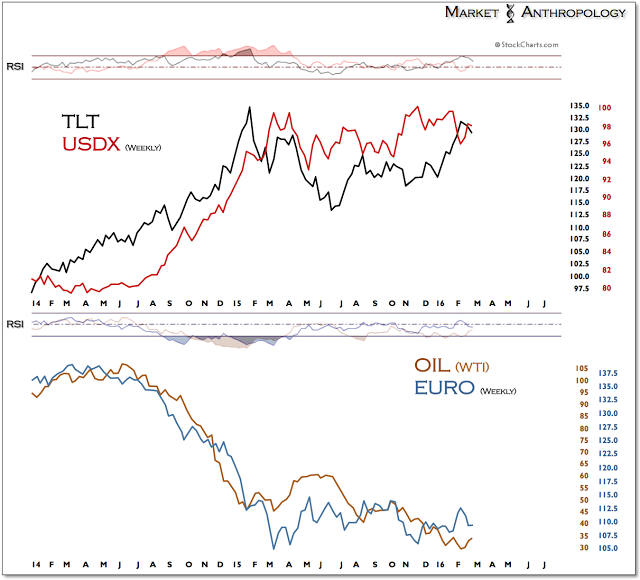
Over the short-term, we expect the dollar and long-term Treasuries (via NYSE:TLT) to continue turning down, while both the euro and oil pull out of their broad momentum bases. As outlined above, we suspect Treasuries will eventually break trend with the dollar later this year, as yields and equities take another leg lower.
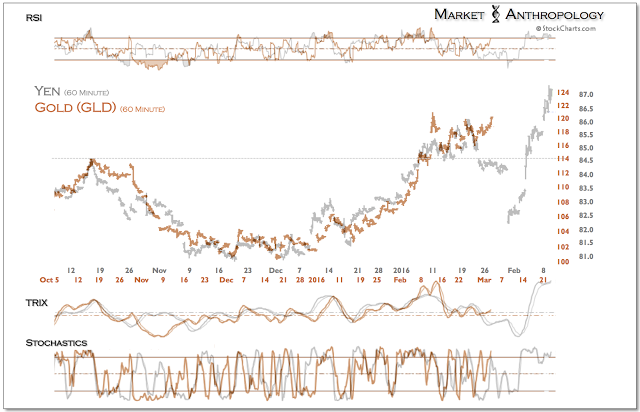
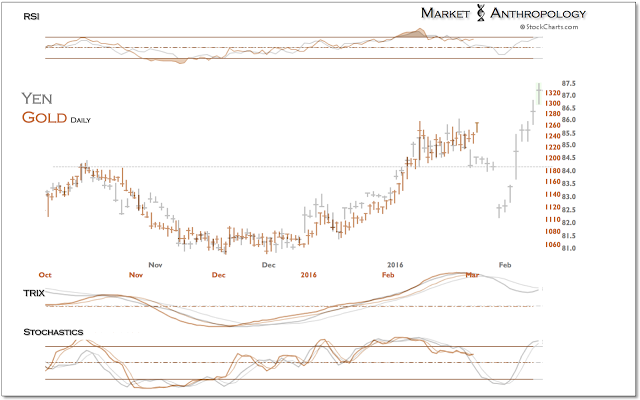
With gold today filling out the breakout structure with the leading pattern in the yen, we remain vigilant that the rally may be shaken over the next few weeks - before resuming its uptrend into Q2.
