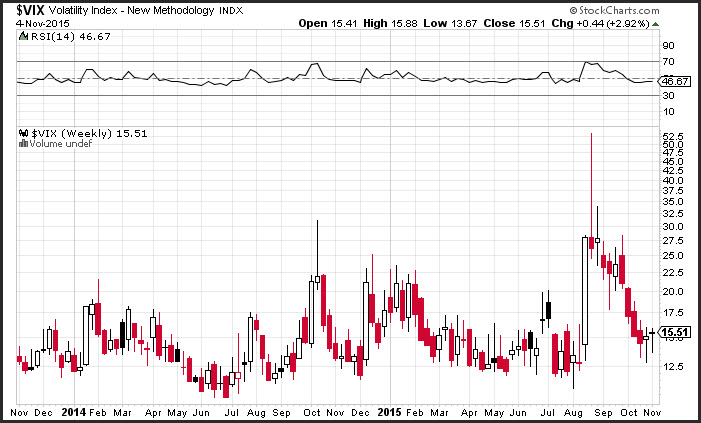
In the later part of the summer, investor’s complacency moved to 52-week lows, just before economic weakness spread across China, and Fed speak tipped the iceberg, which led rapid selloff in riskier assets. This invoked a surge in implied volatility which is the component that plays the largest role in determining the price of an options. This made hedging a portfolio very expensive, which continued to perpetuate for nearly a month.
Implied volatility is the probability that the price of an underlying security such as a stock will reach a strike price. It is measured in percentage terms on an annualized basis and is the main component used to price an option. An option is the right, but not the obligation to purchase or sell a stock or index at a specific price on or before a certain date. For example, an investor can buy an N:SPY $200 December put, which given him/her the right to sell the SPY at $200 at any time until the expiration on December 18.
The most important component in determining the price of the option is to decide on the likelihood that the SPY will get to $200 before December 18. This probability is reflected in the implied volatility calculation. As fear and complacency make their way into the market environment it is directly reflected into implied volatility.
One of the best ways to measure benchmark volatility is to evaluate the VIX volatility index. This index was created by the CBOT to measure the implied volatility of the nearby, at the money strike price, of the S&P 500. For example the current level of 15.51% means that option traders believe that the S&P could move 15.51% over the course of the next 12-months. This is number is used to calculate the probability that a stock will move either above or below the at the money strikes for the large cap index.
July of 2014 appears to be the most recent lows of the VIX, which was followed by the lows seen late this summer near 12.5%. The most recent highs were just experienced when Chinese stocks roiled the broader markets at the same time the Fed was discussing a rate hike. So the Fed held off because they were afraid that the negative sentiment could perpetuate and eventually erode sentiment.
Well, the wait seems to have paid off. Volatility has tumbled from a multi-year intra-day high of 53% back down to 15%. The drop reflects the acceptance of the reality of the market. The actual volatility over the course of the year was nearly unchanged.
The VIX is a mean reverting process. It appears to range between a low of 11% and a high of 90%, which was experienced during the height of the financial crisis. Although it can remain low for a foreseeable period of time, levels around 15% appear attractive to those who might want to protect against an adverse move in the U.S. stock market. 
