
The most heavily traded currencies (EUR, USD) remain on the backseat when it comes to its overall performance as commodity-linked currencies take commanding action to exploit the vulnerabilities in both the European and American counterparts. I'd say, there is a well-founded justification to keep pushing these currencies lower as the immediate risks suggest that the Fed is the next in line to bite the bullet and provide further easing measures, while the ECB may be one or two months behind. It is precisely for the same reasons that we find a suppressed USD that US equities are finding further buying interest at record highs. Easing by a Central Bank is the sugar hit buyers need, even if this time I wouldn't say is different, but rather I will only suggest that the rally defies certain logic. If history is any indication as to when an easing cycle occurs in the context of weakening growth as clearly seen via the depressed US 30-Year bond yield, then this is not the ideal environment for equities overall, especially cyclical sectors.
That said, let's keep moving on by highlighting one of the key triggers for the appreciation in the CAD today, which came courtesy of the first trade surplus in years, further illuminating traders that the Fed and the BoC may be headed, as the US-CA bond yield spread has been telegraphing for some time, in different directions. The AUD, with the RBA potentially affording to hold its record low-interest rate unchanged for a few months now that back-to-back cuts were delivered, is also finding solid buying, diverging dangerously from the yuan. Lastly, the Japanese yen and the Swiss franc, unlike the price of Gold or US 30-year bond yields, tell us that investors have clearly reduced considerably the G20 hedges.
Narratives In Financial Markets
* The Information is gathered after scanning top publications including the FT, WSJ, Reuters, Bloomberg, ForexLive, Institutional Bank Research reports.
- The S&P 500 keeps printing fresh record highs as a result, as counterintuitive as it may sound to the average Joe, of rather poor US data, which increases the odds of the FOMC going ahead with an insurance 25bp rate cut at the end of this month. According to the CME Fedwatch tool, the market assigns a 70% chance of a 25bp cut and 30% of a 50bp cut.
- To recap, the US ADP data came weaker at 102K vs 140k expected. The US trade balance deficit widened to -55.5b vs 54.0b expected, a negative input for US q2 GDP trackers. The final US Markit PMI services index stood out at 51.5 from 50.7 expected, even if the levels it is printing near the lowest in over 3 years. The ISM non-manufacturing index for June was also weaker than expected at 55.1 vs 56.0 expected. To top it off, US factory orders came at -0.7%.
- In a tweet, even if only reiterates what’s been known, US President Trump Trump accused China and Europe of currency manipulation. It read: “China and Europe playing big currency manipulation game and pumping money into their system in order to compete with USA. We should MATCH, or continue being the dummies who sit back and politely watch as other countries continue to play their games - as they have for many years!”
- US Economic Advisor Kudlow repeated that the White House will not lift the existing China tariffs during trade talks even if one of the conditions by China to return to the negotiations is for the US to remove the full amount of tariffs currently enacted. The performance in the US 30-year bond yield tells us not only that anticipation is for the Fed to ease, but no end in sight is seen in the messy trade talks between US and China as global growth weakness deepens.
- Canada May trade balance overwhelms market expectations at +$0.76B vs -$1.70B expected. It’s quite a significant surprise since it’s the first surplus since Dec 2016. The drive in exports growth came via the automotive sector. The resumption of activities at some assembly plants after temporary shutdowns was partly to blame for the boost, Statistics Canada said.
- UK June services PMI, once again, disappoints by printing 50.2 vs 51.0 expected. The eternal dragging of the Brexit issues is causing major uncertainty for businesses and investment intentions, which is clearly taking its toll on the economy during Q2. Markit: "The latest downturn has followed a gradual deterioration in demand over the past year as Brexit-related uncertainty has increasingly exacerbated the impact of a broader global economic slowdown.”
- Trump shows discontent over Iran’s violation of the 2015 nuclear deal by exceeding its uranium stockpile limit. Trump tweet reads: “Iran was violating the 150 Billion dollar (plus 1.8 Billion dollar in CASH) Nuclear Deal with the United States, and others who paid NOTHING, long before I became President - and they have now breached their stockpile limit. Not good!”
Recent Economic Indicators & Events Ahead
If you are going to be trading on Thursday, be reminded that liquidity during the US session will be thinner than usual as US banks will be closed in observance of Independence Day. The inactivity by the majority of traders should lead to abnormally low volatility, even if it can be a double-edged sword to see higher volatility at times.
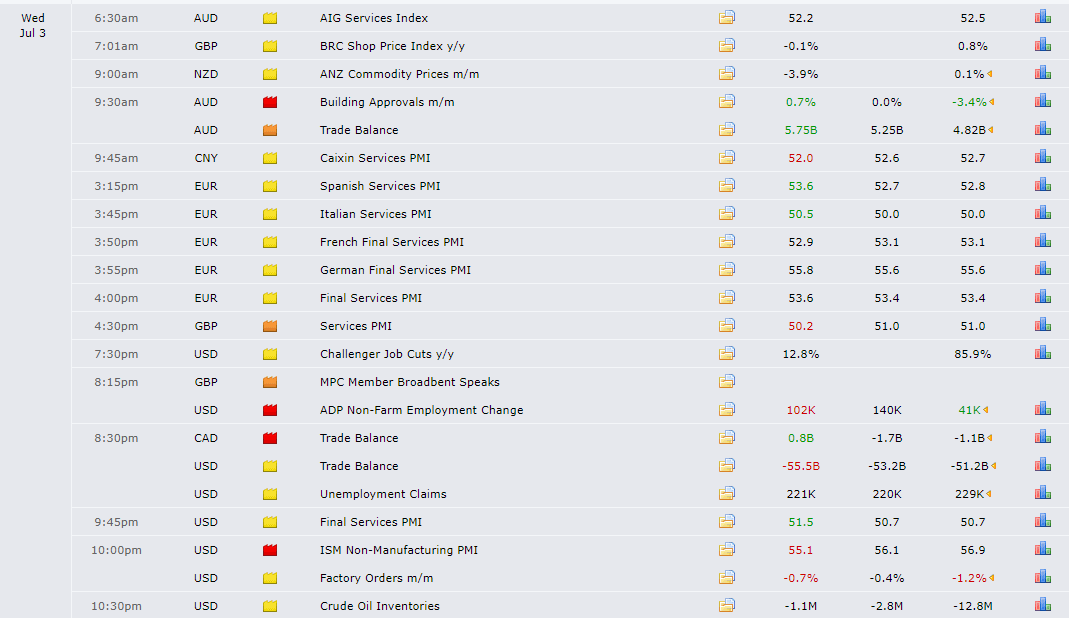
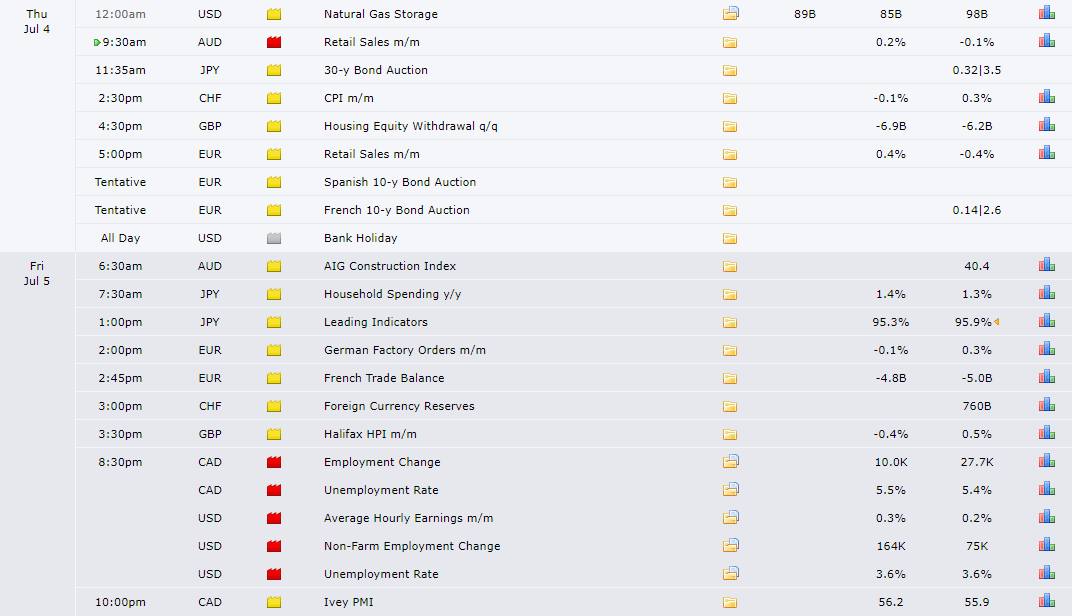
Source: Forexfactory
RORO (Risk On, Risk Off Conditions)
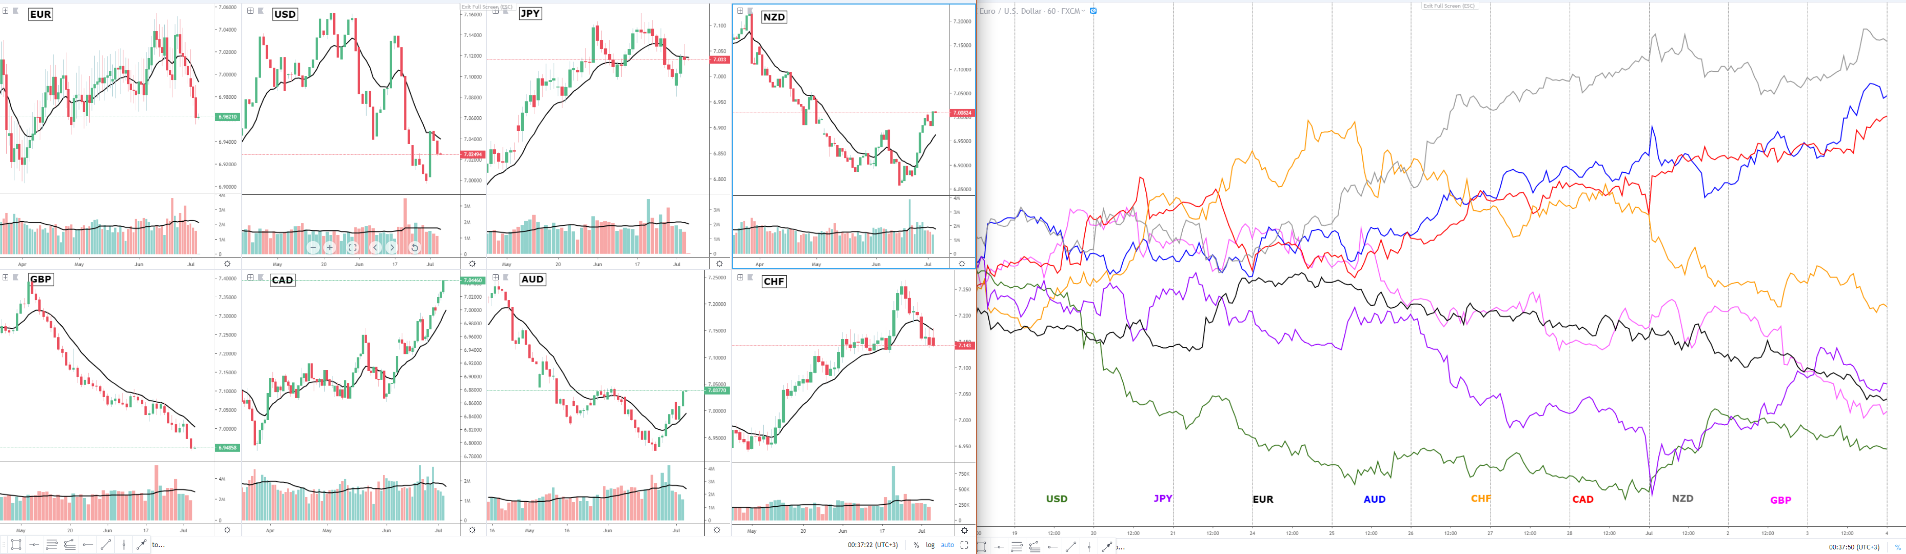
An eagle-eye view of some of the instruments most sensitive to risk sentiment tells us that the environment as we enter Thursday is characterized by the broad-based depreciation of the US dollar as the equally-weighted currency index portrays. This weakness has been well capitalized by commodity currencies.
A notorious outperformer in recent times is the CAD, with the AUD playing more catch up. The CAD not only saw positive fundamentals in the form of its first trade surplus in years, but the rise in US equities acted as an underpinning factor to keep the momentum going.
The new lows in the US 30-year bond yield, not only suppresses the USD appeal further but it also tells us that the market clearly didn't find much justification to buying into the US-China trade truce agreement at the G20 as there is still no meat on the bone for traders to get to re-price a deal.
The market remains fixated in global easing cycles to be dominant as the growth outlook deteriorates amid US protectionist policies. The rejection off highs in the JPY index communicates residual supply but with US yields so low, yen sellers can only partially find an argument to be optimistic via rampant US equities.

A Dive Into FX Majors (Techs, Funda, Intermarket)
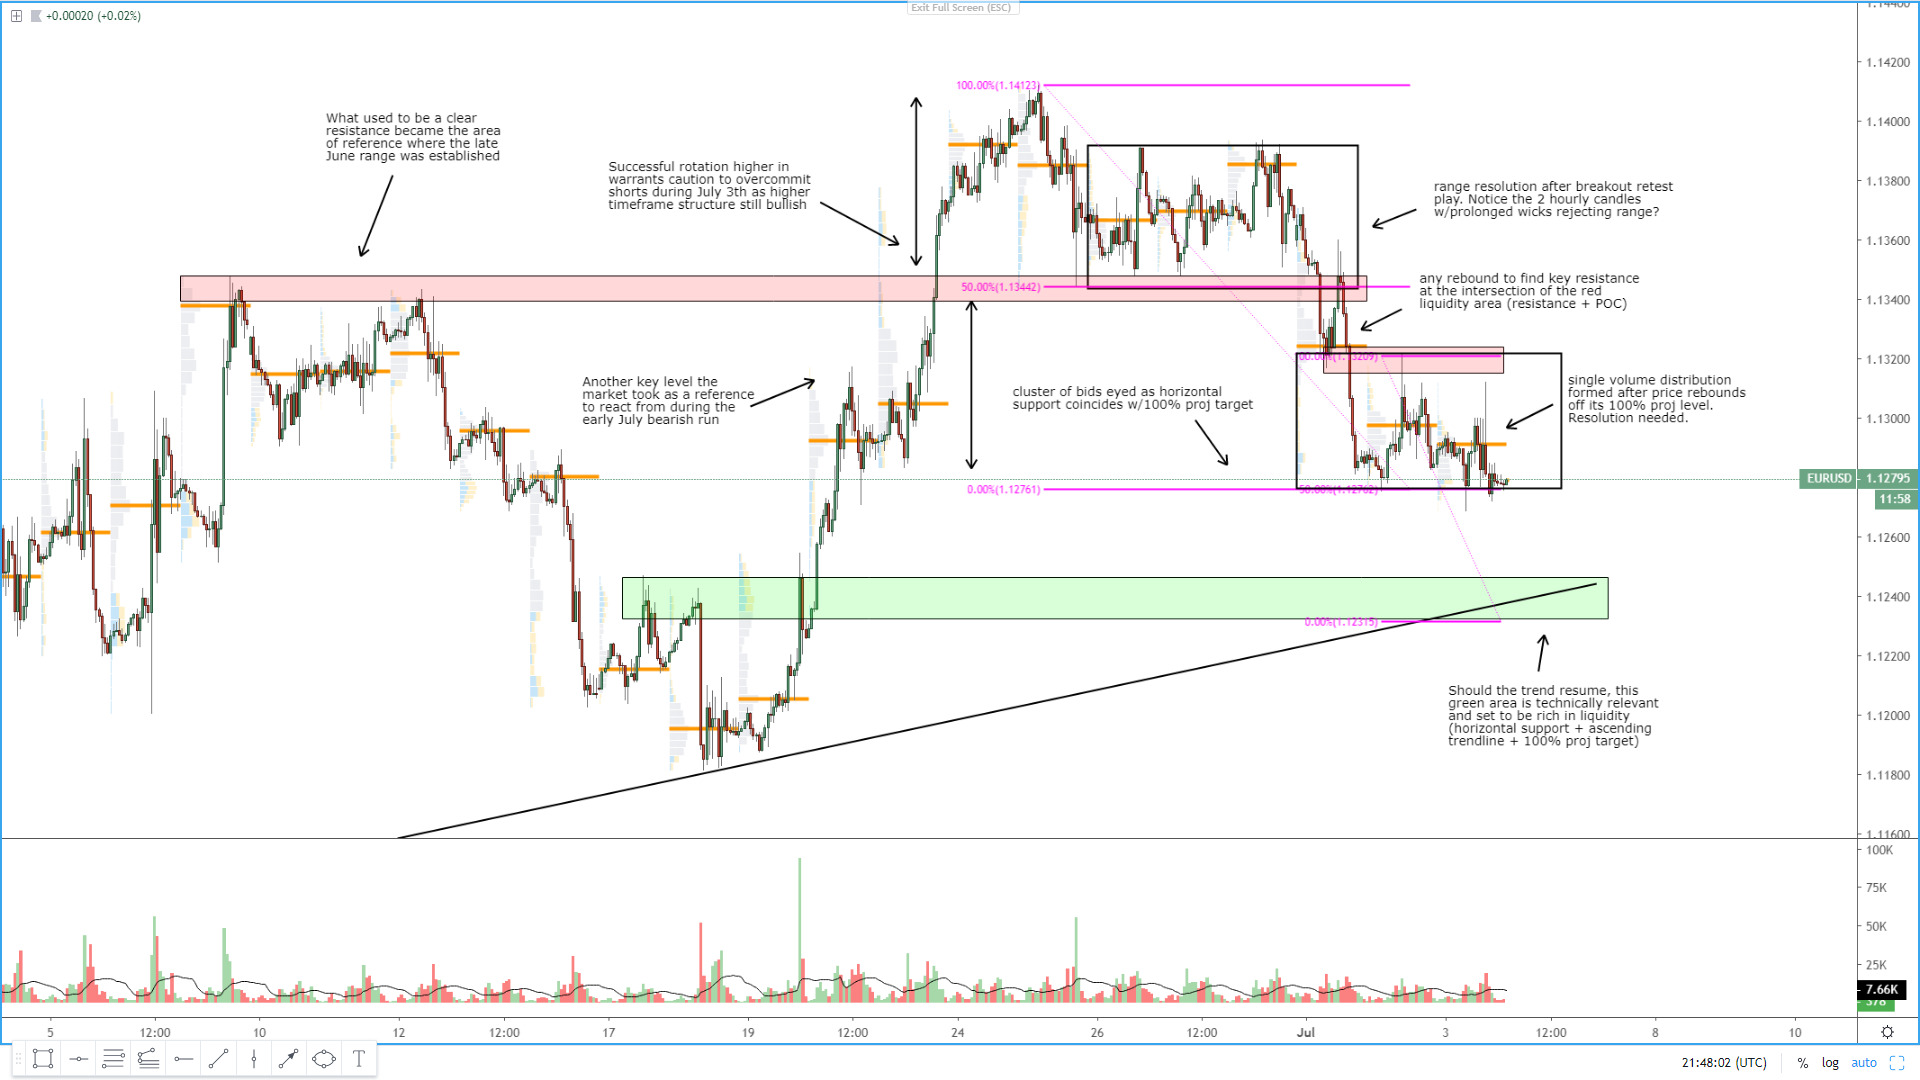
EUR/USD: Consolidation After 100% Projection Target
When scanning through the daily chart, the back-to-back bearish rejections should be a source of concern for buyers, as it also should the fact that the 13-EMA (baseline) is being rejected. There are some positives to highlight though, such as the German-US bond yield spread surge seen, mainly led by the expectation of Fed cuts, as well as the bullish structure of higher highs and higher lows off the daily timeframe. Besides, the price has reached its 100% projection target, where it's paused. The volume is also tapering on the way down (US bank holiday today), which does not tend to be an encouraging signal for follow through as exhaustion becomes a risk.

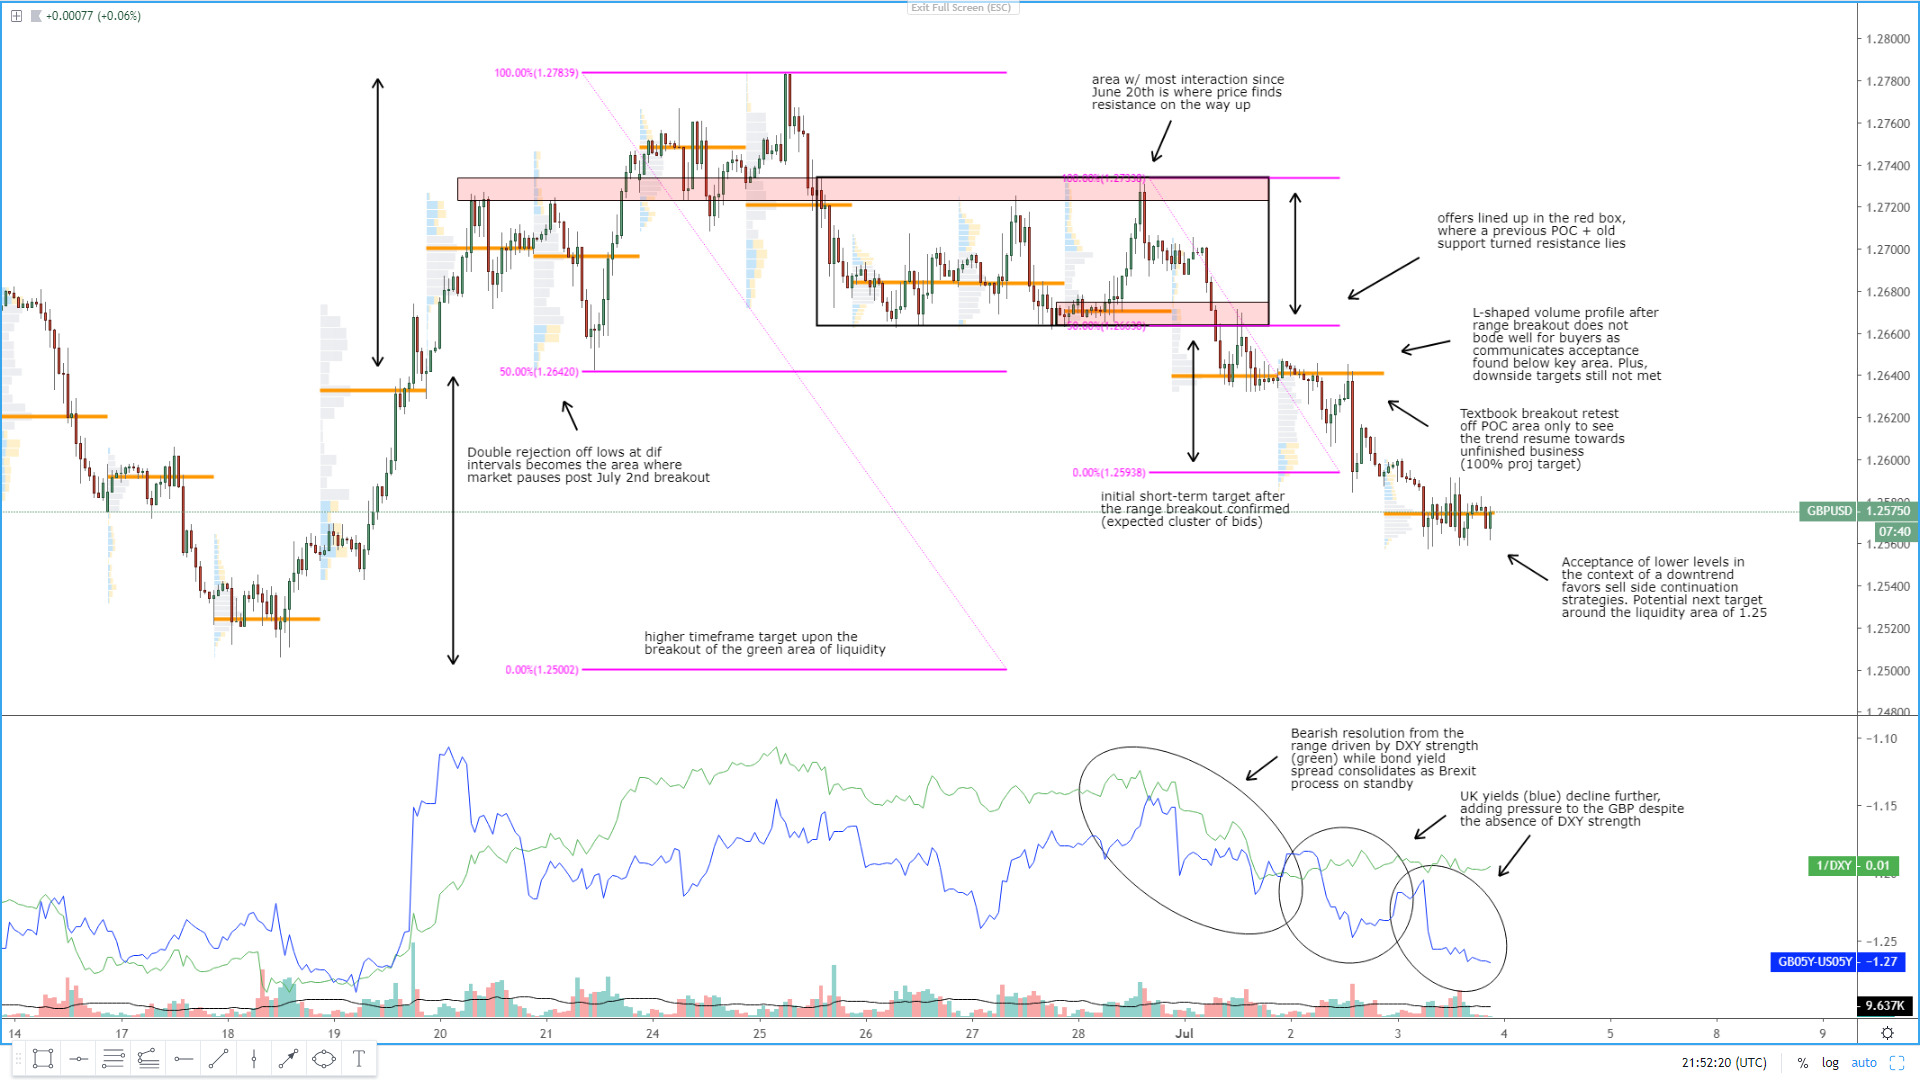
GBP/USD: Looks Set to Test The Area Of 1.25
At first glance, the Sterling looks like a currency poised to grab some liquidity at the area of 1.25 with the price structure very bearish below the 13-EMA (baseline). The test of the liquidity-rich area at the round number should find grateful buyers based on macro intermarket flows, but a very risky proposition judging by technicals. The advancement by sellers is on the tapering of volume but the fact that we are so close to retesting the previous lows, makes me think not many buyers may want to engage at present levels.

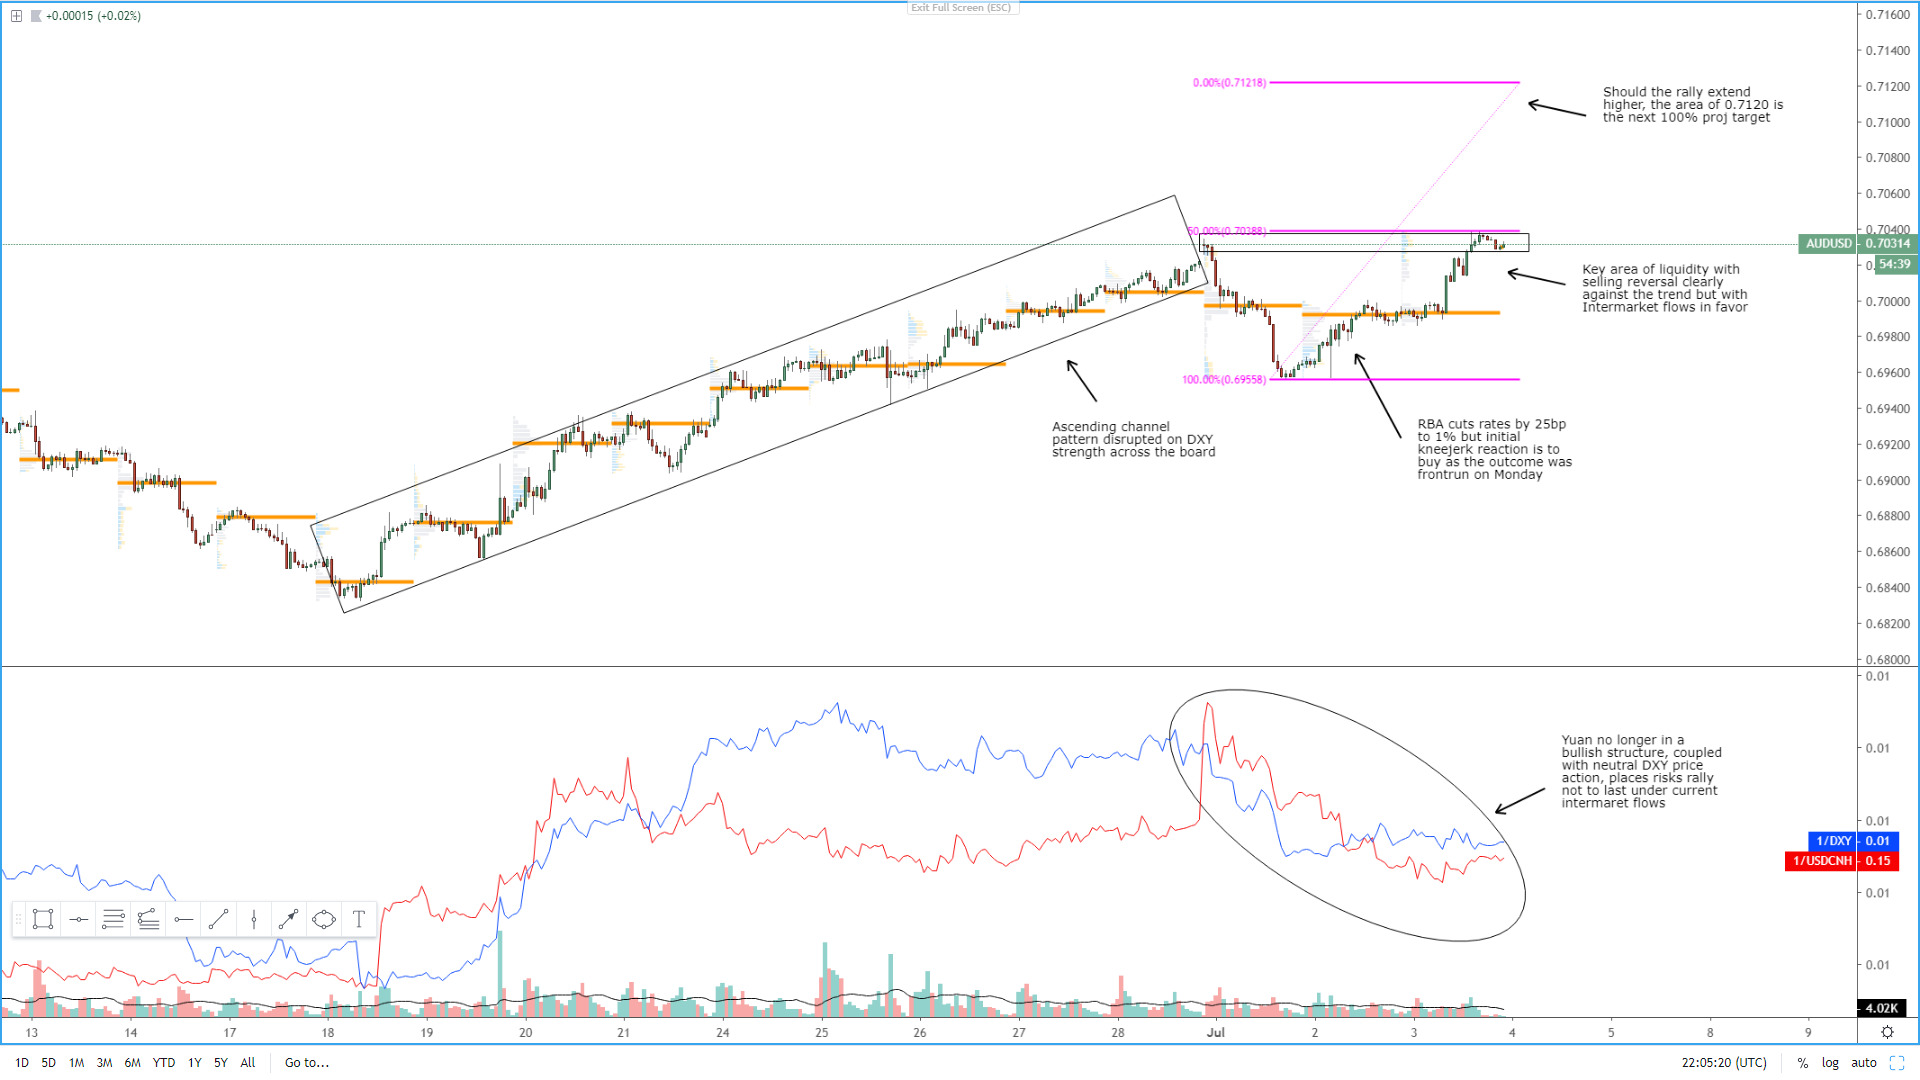
AUD/USD: Technically Bullish, Yuan Strength Not Supporting Run
Technically, the Australian dollar remains in a clear bullish path with no reason to turn bearish off the daily unless price action gives us some clues. The run higher is supported by the positive tone in equities as the S&P 500 breaks into fresh record highs, while the AU-US bond yield spread trades at rather neutral levels. The risk that I find for the Aussie to keep finding further follow through lies on the depreciation of the yuan, the taper of volume on the way up and the strong resistance overhead.
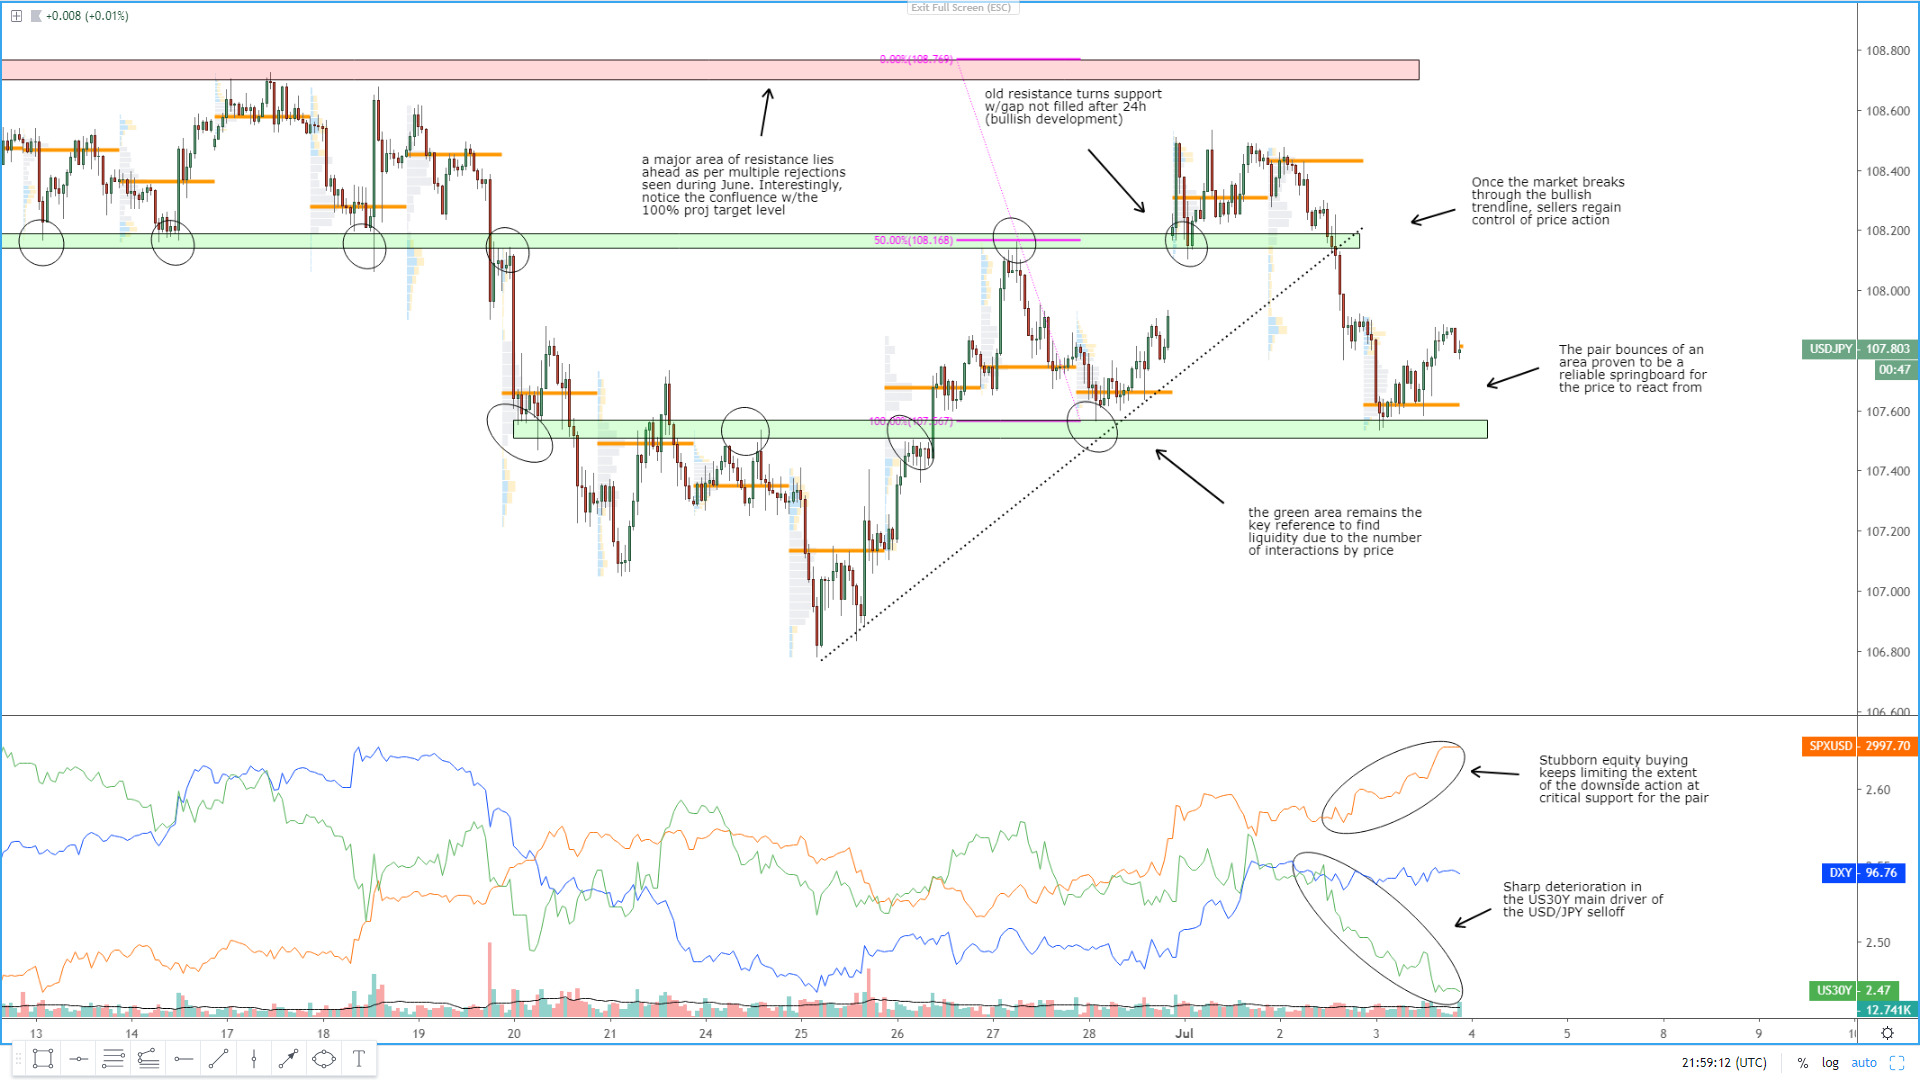
USD/JPY: Bearish Structure, Intermarket Flows Limit Upside
The pair remains bearish below the 13-EMA (baseline) with Wednesday's absorption candle on low volume communicating that some choppiness is likely in the next 24h as the interest to trade the pair fades, especially with the US bank holidays to see liquidity drying up. The rise in the S&P 500 has not acted as a key driver in the pair and I am not expecting much appreciation risk from here unless the bearish structure in the US 30-year bond yield or in the DXY start to turn around.

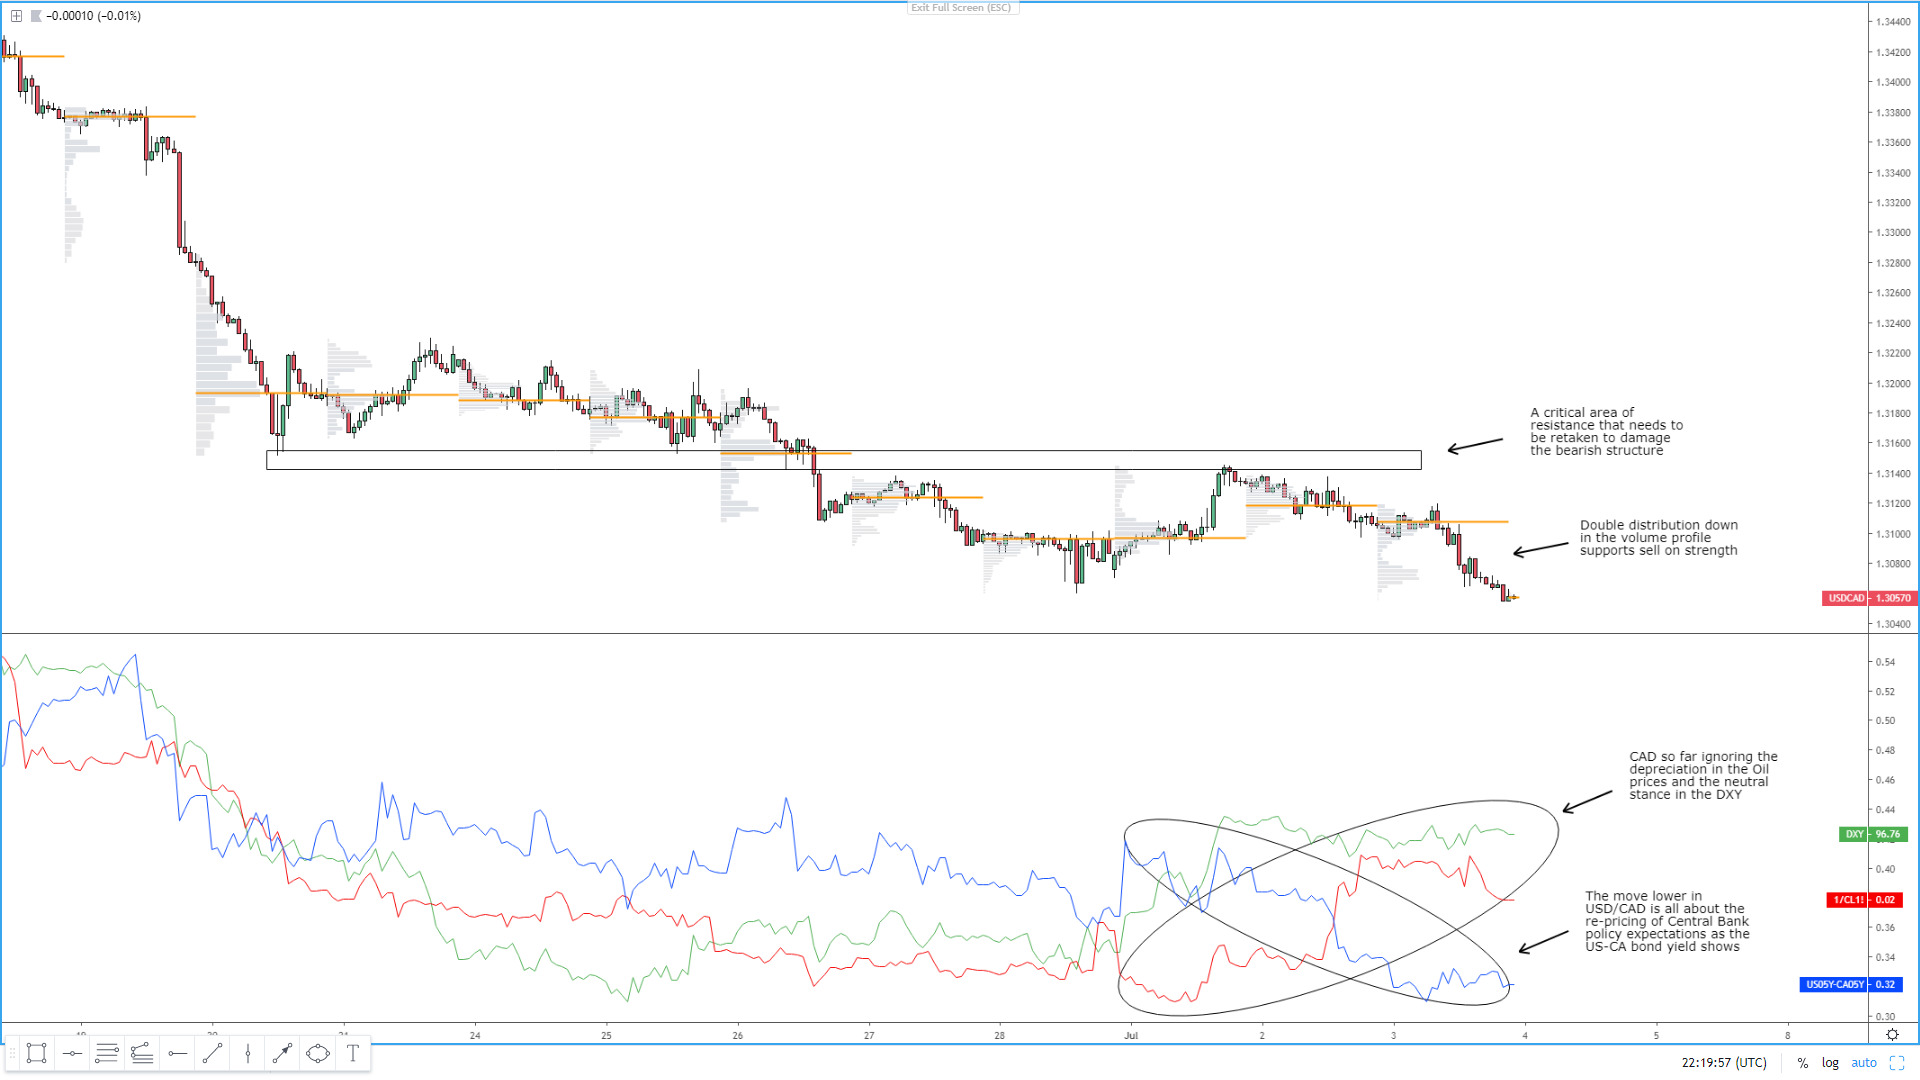
USD/CAD: Bond Yield Spread Takes Front Seat
The Canadian dollar has been the darling on the forex market for quite some time now. The overstretched move lowe has resulted in the pair reaching a critical projected target area around 1.3050, even if the very bearish NY close does not suggest sellers have had enough. The CA-US bond yield spread has put an enormous amount of pressure on the pair, as capital flows return to Canada in expectations that the Fed and the BoC monetary policy paths will start to diverge as Canada's upbeat data keeps justifying.

Important Footnotes
- Risk model: The fact that financial markets have become so intertwined and dynamic makes it essential to stay constantly in tune with market conditions and adapt to new environments. This prop model will assist you to gauge the context that you are trading so that you can significantly reduce the downside risks. To understand the principles applied in the assessment of this model, refer to the tutorial How to Unpack Risk Sentiment Profiles
- Cycles: Markets evolve in cycles followed by a period of distribution and/or accumulation. To understand the principles applied in the assessment of cycles, refer to the tutorial How To Read Market Structures In Forex
- POC: It refers to the point of control. It represents the areas of most interest by trading volume and should act as walls of bids/offers that may result in price reversals. The volume profile analysis tracks trading activity over a specified time period at specified price levels. The study reveals the constant evolution of the market auction process. If you wish to find out more about the importance of the POC, refer to the tutorial How to Read Volume Profile Structures
- Tick Volume: Price updates activity provides great insights into the actual buy or sell-side commitment to be engaged into a specific directional movement. Studies validate that price updates (tick volume) are highly correlated to actual traded volume, with the correlation being very high, when looking at hourly data. If you wish to find out more about the importance tick volume, refer to the tutorial on Why Is Tick Volume Important To Monitor?
- Horizontal Support/Resistance: Unlike levels of dynamic support or resistance or more subjective measurements such as fibonacci retracements, pivot points, trendlines, or other forms of reactive areas, the horizontal lines of support and resistance are universal concepts used by the majority of market participants. It, therefore, makes the areas the most widely followed and relevant to monitor. The Ultimate Guide To Identify Areas Of High Interest In Any Market
- Trendlines: Besides the horizontal lines, trendlines are helpful as a visual representation of the trend. The trendlines are drawn respecting a series of rules that determine the validation of a new cycle being created. Therefore, these trendline drawn in the chart hinge to a certain interpretation of market structures.
- Correlations: Each forex pair has a series of highly correlated assets to assess valuations. This type of study is called inter-market analysis and it involves scoping out anomalies in the ever-evolving global interconnectivity between equities, bonds, currencies, and commodities. If you would like to understand more about this concept, refer to the tutorial How Divergence In Correlated Assets Can Help You Add An Edge.
- Fundamentals: It’s important to highlight that the daily market outlook provided in this report is subject to the impact of the fundamental news. Any unexpected news may cause the price to behave erratically in the short term.
- Projection Targets: The usefulness of the 100% projection resides in the symmetry and harmonic relationships of market cycles. By drawing a 100% projection, you can anticipate the area in the chart where some type of pause and potential reversals in price is likely to occur, due to 1. The side in control of the cycle takes profits 2. Counter-trend positions are added by contrarian players 3. These are price points where limit orders are set by market-makers. You can find out more by reading the tutorial on The Magical 100% Fibonacci Projection