I recently explained that it’s one thing for a central bank to artificially prop up its own stock market. It’s another thing entirely to even imagine doing something similar to falling oil prices. What’ll they do – buy oil futures? Give me a break.
Oil hit a six-year low this week. As I write this, it’s around $43, closer yet to the $42 target I forecast when oil bounced back to $63. After another tepid bounce, it will very likely fall to the $32 support level we saw in late 2008. John Kilduff, a leading oil analyst who will be speaking at our Irrational Economic Summit in Vancouver next month, sees this happening earlier than his original Christmas call.
But oil just got another kick in the shins this week when China decided to return to its old tricks again.
The People’s Bank of China's move to intentionally lowered its currency ‑- to fight the slowdown made all too obvious by an 8.5% decline in exports -- is fundamentally no different than injecting $0.5 trillion into its stock market’s bloodstream or buying empty condos to keep its real estate from tanking. It’s one economic manipulation after the other!
This raised concern over China’s demand for commodities. A weaker yuan probably means fewer imports, and so less demand. As a result, oil and other commodity prices slumped.
All of this might be just a segue way into a much greater point -- the overarching collapse in commodity prices that is already beginning to ravage the emerging world. This will only get worse in the years to come and will quickly take our own stock market down with it.
Commodity prices move in a 30-year cycle that has run like clockwork over the past century. Overall, it’s been pretty reliable since the early 1800s.
We’ve been in a “down cycle” since commodity prices peaked in mid-2008. And in line with the cycle, they won’t bottom out until around the early 2020s – likely by 2023 at the latest.
There are two major reasons for this:
No. 1: The demographic slowdown in developed nations, which affects demand.
And No. 2: The economic slowdown in China
The Chinese have dominated the consumption of industrial metals and energy for years to feed the country’s rapidly growing economy and global manufacturing export machine.
For these reasons, as much as commodities have fallen -- 57% overall and up to 80% in oil and 70% in iron and coal -- they still have further to fall in a series of continued crashes.
More importantly, this continues to be the best leading indicator of the global financial crisis ahead because it affects stock markets in both the emerging and developed worlds.
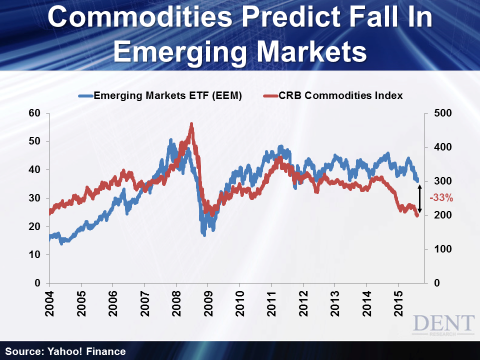
Now, I’ve shown before how commodity prices move more in tandem with emerging market stocks. Much more so than a stock index like the S&P 500.
Look at the chart below. It compares two leading measurements for commodities and emerging stocks: the CRB Commodities Index and (ARCA:EEM), the ETF for emerging market stocks:

That correlation is plain as day.
But as you can tell, there’s been a growing divergence building between the two since the middle of last year. There’s now a 33% gap.
That doesn’t mean the correlation has stopped working. It just means emerging-market stocks have at least that much to fall.
They’re already down 36% from their top in late 2007. We’ll likely see that gap close with a breakdown in emerging market stocks in the months ahead.
I expect the EEM index to hit $18 by early 2017 (a 50% crash from here). Ultimately, I see it going as low as $10 by 2020 to 2023 as commodity prices continue to fall through the years to come.
At $36, this index is already testing its three-year lows. The final support level is the 2011 low of $33.50. A break below $36 shows clear weakness. A break below $33.50? That would mean curtains for emerging market stocks.
But like I said, falling commodity prices hurts stocks in developed countries too.
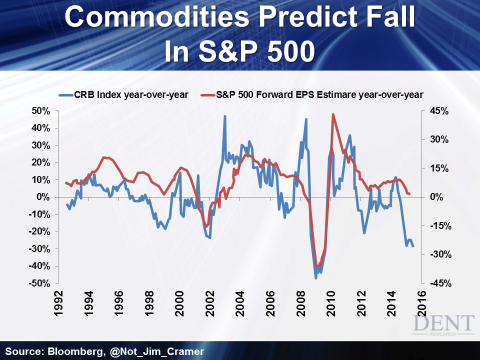
Here’s a chart to explain:

This one suggests that the S&P 500 is ready to fall as well. And overall, it strongly suggests that U.S. and developed country stocks are about to crash something like 25% to 30% or more.
This chart shows that changes in commodity prices and forward S&P 500 earnings per share roughly follow one another. When one goes down, typically, the other goes with it.
If commodity prices fall, it brings global trade down with it. That leaves S&P 500 companies in a world of hurt since so much of their sales are overseas. And since analysts are always looking forward, earnings are going to be revised lower as trade overseas continues to weaken. When that happens, stocks will follow!
Like I said, I expect a 25% to 30% crash, minimum, in the first wave down in the next stock crash. That’s similar to the recent China crash.
Such a crash is most likely to begin in the classic crash season between late August and mid-October of this year.
So be sure to get as defensive as you possibly can in your investments by late August. That goes especially for any bounces in stocks or even oil we might see. They’ll likely occur just ahead before a larger crash sets in.
