Prospects for a “mini” trade deal between the U.S. and China leading to further progress have lifted agricultural commodities, taken the wind out of gold and left energy markets unimpressed. Turkey’s advance into Syria has yet to influence safe haven asset accumulation.

Energy
CRUDE OIL prices fell for the first time in four days yesterday despite the announcement of the first steps in a trade deal at the end of last week, which would have lifted hopes for global growth. Customs data from China showed its crude oil imports for September were 2.2% lower than a month earlier at 41.2 million tons.
Russia’s energy minister Alexander Novak was in Jeddah yesterday to sign a long-term charter with OPEC. He commented that it was important that OPEC+ can react quickly to market changes. Meanwhile, Saudi Arabia said that all damages from the September 14 attacks had been repaired and that production was back to pre-attack levels at 9.9 million barrels per day (bpd). The number of U.S. rigs producing oil rose for the first time in eight weeks, hitting 712 as at last Friday.
Speculative accounts trimmed net long positions for a fourth straight week in the week to October 8, the latest data from CFTC show. Net longs are now the lowest since the week of June 11.
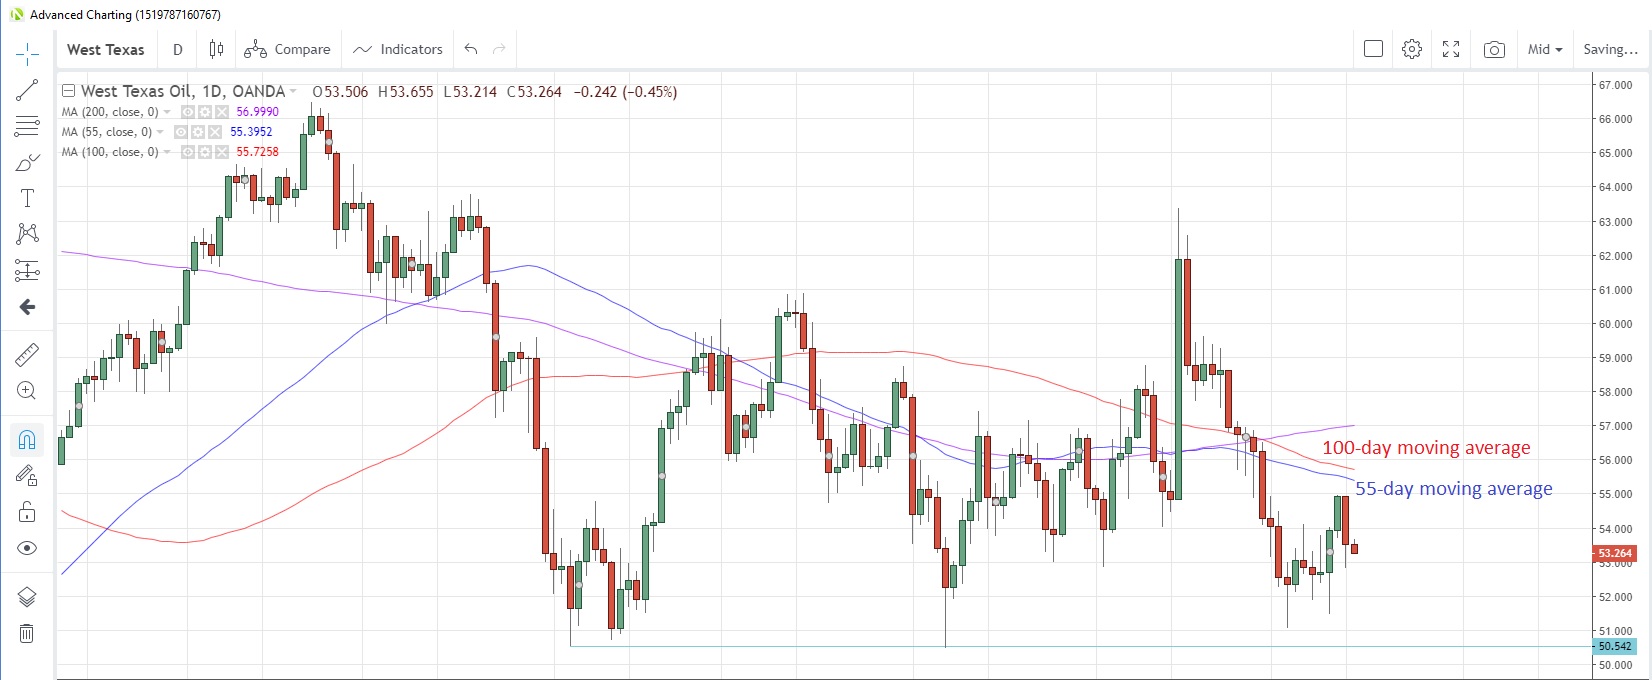
West Texas Intermediate (WTI) remains capped by the 55- and 100-day moving averages at $55.40 and $55.73 respectively. The 100-day average has capped prices on a closing basis since September 24.
NATURAL GAS is in the process of staging a recovery from the seven-week lows struck last Friday amid forecasts for colder weather across the U.S. in the October 19-23 period. Prices have risen for the past three days and are edging toward the 55- and 100-day moving averages at 2.3229 and 2.3281, respectively.
China’s headline imports for September showed a sharp deterioration but imports of natural gas were 8.2 million tons, bringing the year-to-date total to 71.2 million tons, a 10% increase from the previous year. Last week’s inventory data to October 4 showed a smaller total of 98 billion cubic feet (bcf) compared with 112 bcf the previous week. That’s still above the 5-year average of 89 bcf.
Precious metals
GOLD is holding steady after a two-day decline at the end of last week as U.S. President Trump announced a “mini” trade deal with China dubbed Phase 1. The deal is seen as a major breakthrough and paves the way for a partial trade deal, though China have been quick to state that a lot of work still needs to be done. The improvement in sentiment took its toll on gold and the Thursday/Friday losses tipped the precious metal into negative for the week. It’s still trading within the downward-sloping channel mentioned last week, with the outer limits now approximately at 1,447 and 1,513.
Exchange-traded funds (ETFs) added to gold holdings for a 20th session, Bloomberg reported yesterday. That’s the longest buying streak in a decade.
SILVER has fared a tad better than gold, rallying for the past three days with exchange-traded funds adding to their existing holdings for the past six sessions, according to Bloomberg reports, bringing total net purchases for 2019 to 108 million ounces. Speculative investors had also been net bullish at the last reporting date on October 8, turning net buyers for the first time in five weeks, according to CFTC data.
PLATINUM continues its retreat from two-week highs as the metal struggles to sustain a move above the 55-day moving average attempted on Thursday. That moving average is now at 898.65 with platinum currently trading at 894.48.
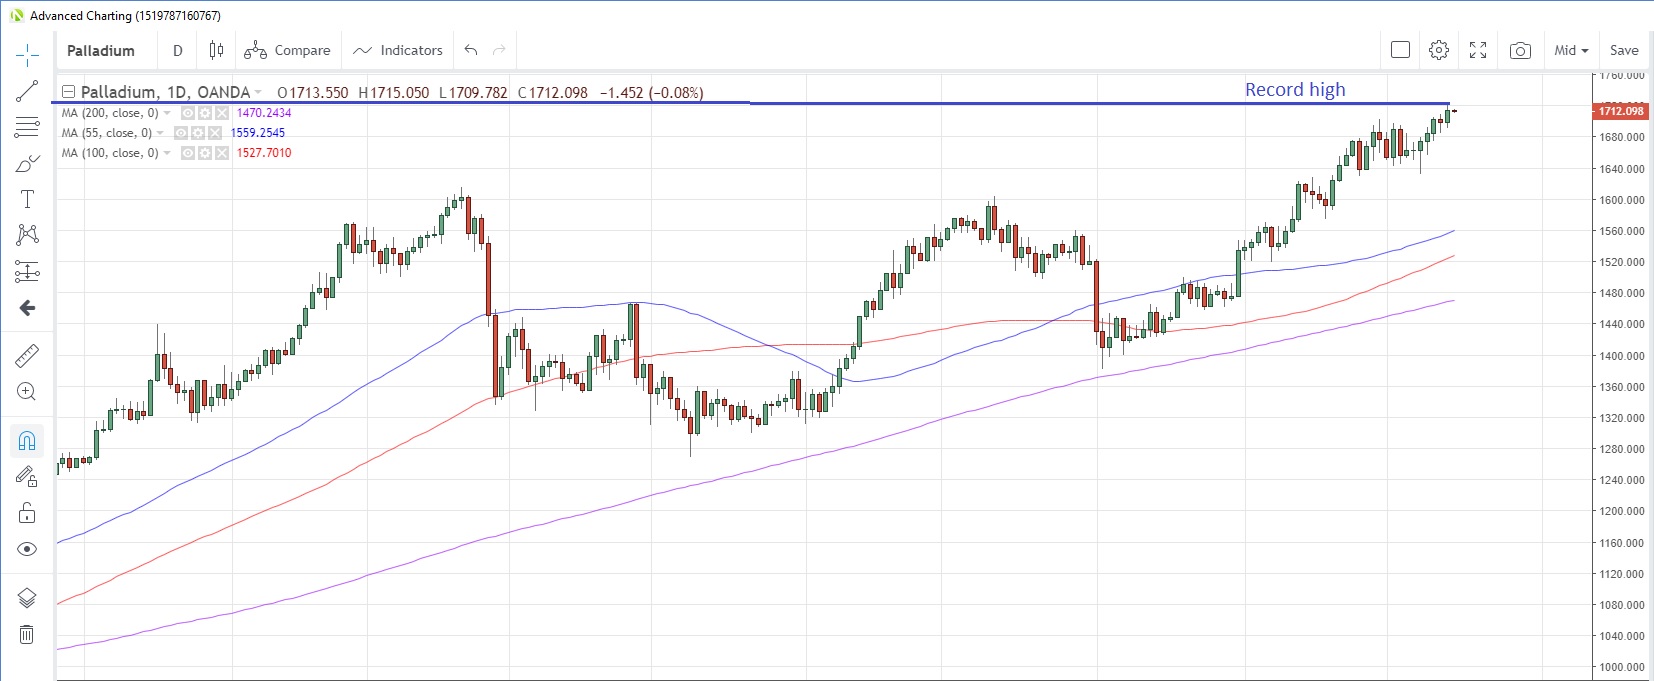
PALLADIUM reached a new record high yesterday as the implications for some sort of trade deal boosted the metal. The assumption is that a deal would improve the prospects for global growth, which in turn would increase demand for cars and hence boost demand for the metal in pollution control devices in those cars.
Speculative investors were well positioned for the latest record-breaking rally, having increased net long positions for the past six weeks, lifting net longs to the highest in more than seven months.

Base metals
COPPER’s rally after the mini trade deal announcement is currently stalling at the 100-day moving average at 2.6293. That moving average has held on a closing basis since September 13.
China’s headline import and export data for September were dismal, with a three-year equaling low 8.5% contraction. However, copper imports were a bright spot in the report, rising to the highest this year at 445,000 tons, but still down 15% from a year earlier. Copper stocks at warehouses monitored by the London Metal Exchange (LME) were higher for a second straight week, the first time this has happened since July.
Speculative investors remain a bit skeptical about the industrial metal’s rise, having increased net short positions for a third straight week, according to the latest report to October 8 from CFTC. Net shorts are now at a five-week high.
Agriculturals
U.S. President Trump said that China has agreed to increase purchases of U.S. agricultural products to $40-$50 billion annually under the “Phase 1” trade agreement. This compares with the 2017 U.S. exports total of $19.5 billion.
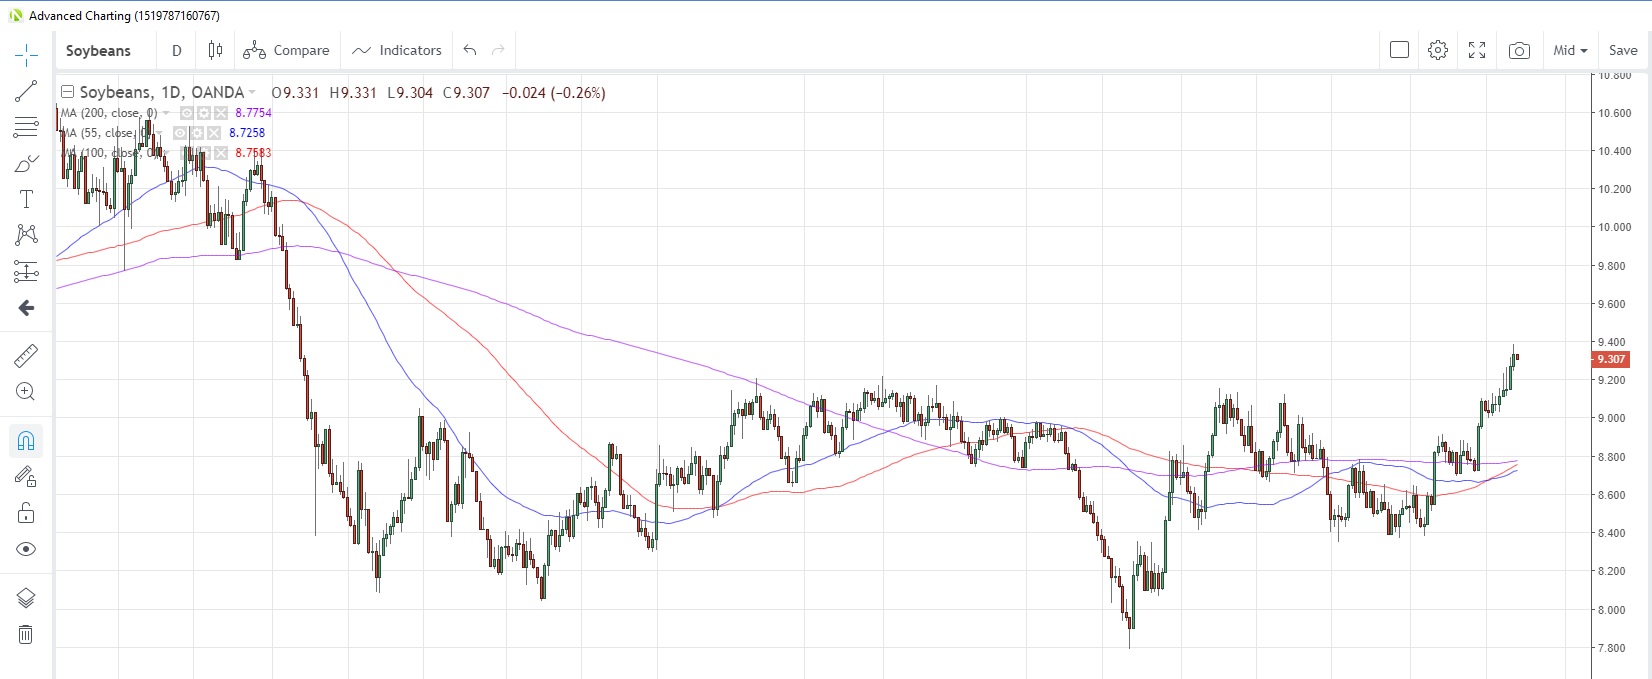
It was inevitable therefore that agricultural commodities rose, with SOYBEANS an outperformer. The commodity hit a 16-month high of 9.38 yesterday, having risen for seven consecutive days. Soybeans were given an additional boost from the recent World Agricultural Supply and Demand Estimates (WASDE) report from the U.S. Department of Agriculture on Friday, which pegged U.S. soybean supply lower than expected.
Speculative investors were already bullish on the commodity prior to the latest surge, having boosted net long positions for a fourth straight week to hit the highest since June 2018.

CORN also benefitted from the trade deal announcement, rising to the highest since August 12 yesterday. The rally hit the 100-day moving average at 3.9568 but failed to trade above it. That moving average has capped prices for nine weeks. Speculative investors trimmed net short positions for a second straight week, reducing them to the lowest since September 3.
SUGAR is consolidating gains made since the beginning of September as the market faces a supply shortage for this season. The International Sugar Organisation (ISO) has pegged the 2019/20 season deficit at nearly five million tons, which is helping to support prices. However, the shortfall comes after two straight years of surpluses and the ISO reckons there is still a 95 million ton backlog to clear.
WHEAT prices touched a near three-month high yesterday following last week’s trade deal framework. Prices have stalled near the 61.8% Fibonacci retracement of the drop from June 27 to September 3 at 5.109 and could be facing their first down-day in three today.
Speculative investors turned net sellers of the commodity for the first time in five weeks, according to data as at October 8 from CFTC. Net shorts are now at the highest since early-June.
