Speculation that a U.S.-China “mini” trade deal is close and OPEC is getting ready to trim production in December has failed to give oil a lift. Precious metals have suffered on a better risk appetite mood while industrial metals are finding support. Agricultural commodities are consolidating recent gains.

Energy
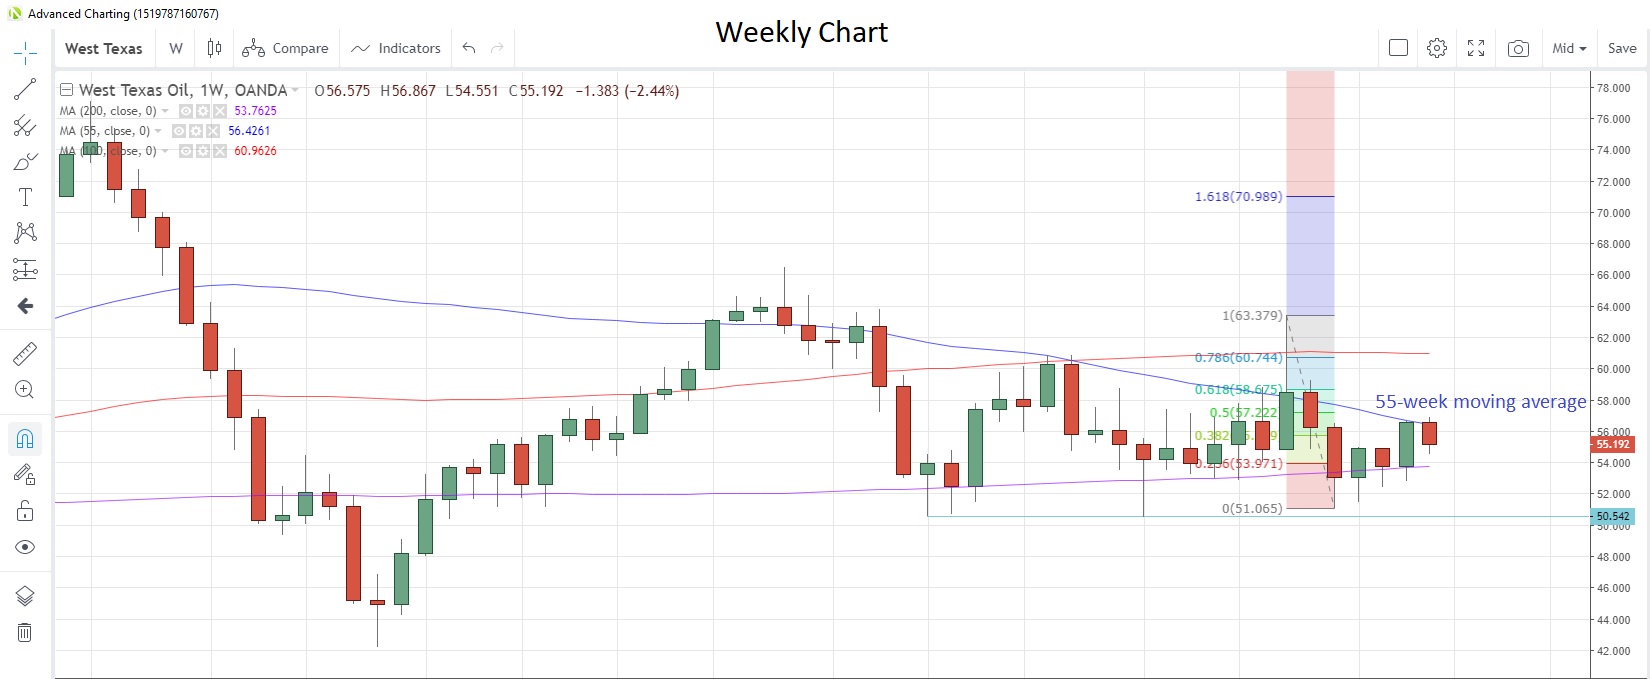
CRUDE OIL prices have fallen for the past three days despite rumours circulating that OPEC and its allies are planning to cut supply further at its December meeting. Russia has stated it is “too early” to commit to deeper production cuts ahead of the December 5-6 gathering in Vienna. Last week, West Texas Intermediate (WTI) posted the biggest weekly gain in five weeks to test the 55-week moving average at $56.72, which held at this attempt.
The number of U.S. oil rigs in production fell for the first time in two weeks and is now at the lowest since April 2017. Saudi Arabia announced that the Aramco IPO will go ahead on Dec. 4, with trading starting on Dec. 11. Speculative investors were net buyers of the commodity for a second consecutive week, according to the latest data snapshot from CFTC as at October 22.
NATURAL GAS is facing the biggest weekly gain in eight weeks this week amid forecasts of a cold snap hitting the U.S. East and Midwest in early November. Prices touched the highest in more than a month yesterday, trading above the 200-day moving average for the first time since September 18.
Inventory data as of October 18 showed an increase of 87 billion cubic feet (bcf) to 3.6 trillion bcf, slightly below estimates of 88 bcf but well above the 5-year average of 73 bcf. Speculative investors increased net short positions for a third straight week, raising them to the most since the week of August 13.
Precious Metals
GOLD has taken a back seat when it comes to demand as the hopes for a breakthrough in the U.S.-China trade negotiations breathe life into risk appetite and reduce the need for safe haven assets. The precious metal has retreated from near four-week highs as demand waned, and failed to close above the 55-day moving average at 1,504 this time around.
Demand is also slowing from the Indian retail sector as last Friday, the traditional, most auspicious day for buying gold in India, passed with sales reportedly down about 20% from a year earlier. High prices and a slowing economy have been blamed for the weak demand.
Speculative investors remain bullish however, increasing net long positions for a third straight week in the week to October 22, CFTC data show. The buying pulled net long positioning from three-month lows.
SILVER is also under pressure, facing the biggest weekly loss in more than a month, despite the prospects of a Fed rate cut later today and possible pickup in demand if the U.S.-China Phase 1 trade deal is signed. Speculative accounts were net buyers at the last reporting date, lifting net long positioning from an 11 week low. The gold/silver (Mint ratio) has been steady near one-month lows this week.
PALLADIUM reached a new record high above 1,800 on Monday and has consolidated those gains since. There is a perceived increase in demand for the vital metal used in automobile emissions control units amid more stringent environmental regulations in Europe and China. Speculative investors have had a good run on long positions and some have taken the latest gains as an opportunity to book some profits. Accounts were net sellers for a second consecutive week in the week to October 22, according to the latest data from CFTC.
PLATINUM gains have been limited in comparison and peaked at the end of last week. Last week’s gains were the most since the end of August, but the metal has slid 0.65% so far this week. Speculative investors remain bullish on the metal, having boosted net long positions to the highest since February last year.
Base Metals
COPPERprices reached the highest in six weeks yesterday amid hopes that a “mini” U.S.-China trade deal will stir up increased demand for the industrial metal. In addition, supply concerns were heightened after workers at Chile’s ports decided to stop work for two days starting yesterday in a strike protest. Union members also staged three days of stoppages last week.Speculative investors mounted the bull bandwagon in the latest reporting week to October 22, turning net buyers for a second straight week, according to CFTC data. Stocks of copper at warehouses monitored by the London Metal Exchange (LME) as at Monday were the lowest since April.
Agriculturals
SOYBEANS look set to fall for a second week after hitting the highest since June 2018 on October 22. Soybeans have fallen 2.5% from that peak but today are facing the first up-day in four days. The 55-day moving average at 8.855 as acting as the next technical support point and prices have traded above that moving average since September 12.
China has said that the terms of the Phase 1 agreement are “basically complete,” suggesting that the deal will be ready for signing by the two leaders at the APEC summit in Chile next month. The U.S. has stated that inspections of soybeans ready for export are up 18% from a week earlier to 1.57 million tons, with about a third heading to China, according to Bloomberg reports.
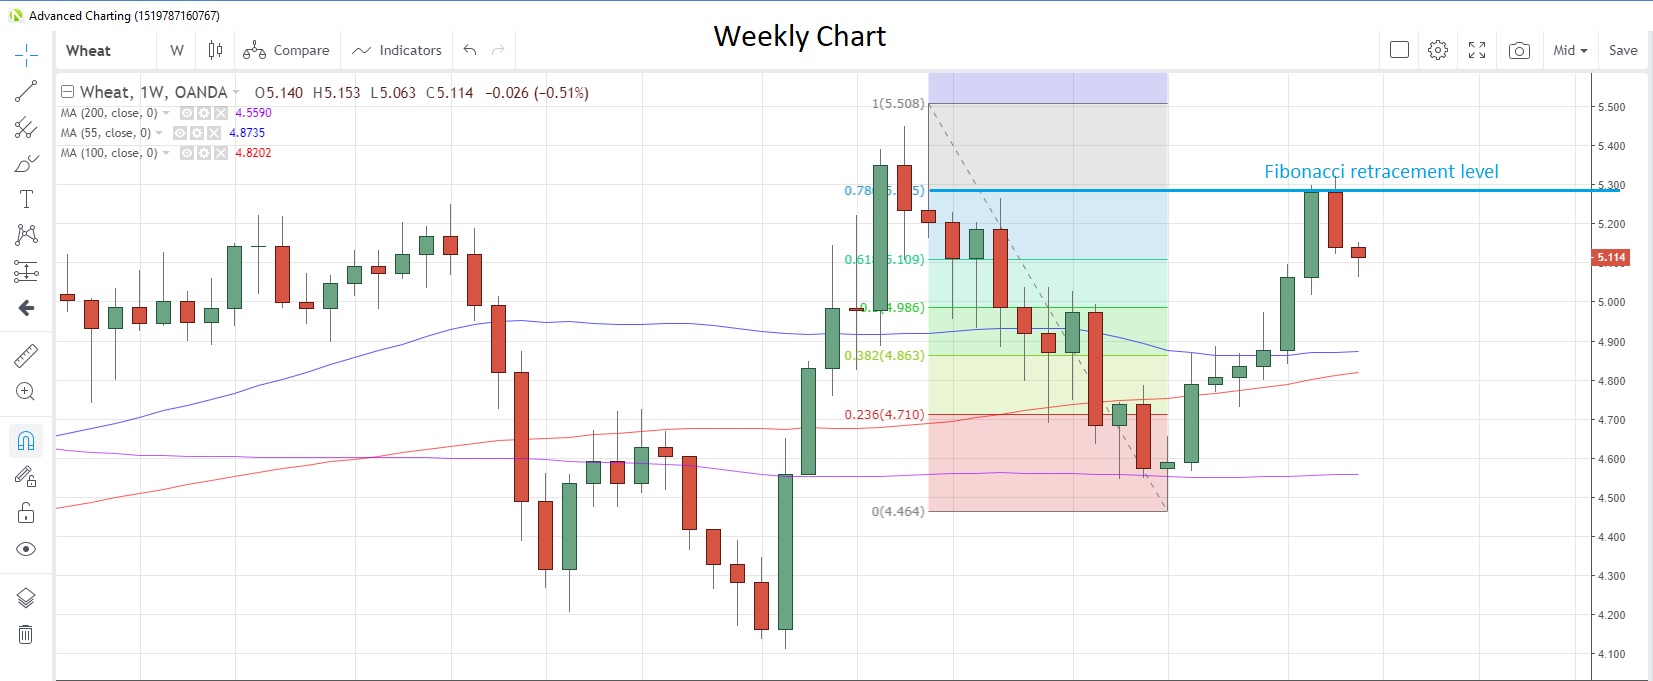
WHEAT fell last week for the first time in eight weeks after reaching the highest since June on the back of China’s agreement to buy more U.S. agricultural products as part of the Phase 1 deal. The rally stalled near the 78.6% Fibonacci retracement level of the June-September drop at 5.285.
A recent Bloomberg survey showed U.S. wheat growers are set to plant the least number of acres of wheat in 110 years during this season. Weak prices and better returns for planting corn have been cited for the drop. Speculative investors have increased net long positions to the most since the week of July 30.

CORN looks set for a second daily gain and first weekly gain in three weeks, with technical levels providing near-term support and resistance. The 55-week moving average support was tested earlier this week while the 100-day moving average resistance has been in place since August 12.
An uptick in corn feed demand is possible as China’s pork industry recovers from the bout of swine fever that swept through the industry. This could coincide with smaller corn harvests domestically due to unfavourable weather conditions and lend support to corn prices.
Speculative investors turned net sellers for the first time in four weeks.
SUGAR has been consolidating between the 55- and 200-day moving averages at 0.1142 and 0.1205 respectively since late-September. Upside momentum has stalled for the moment, but the threat of a supply shortfall during the current season should keep prices supported.
Speculative accounts remain skeptical, having increased net short positions to the highest since records began back in 1983.
