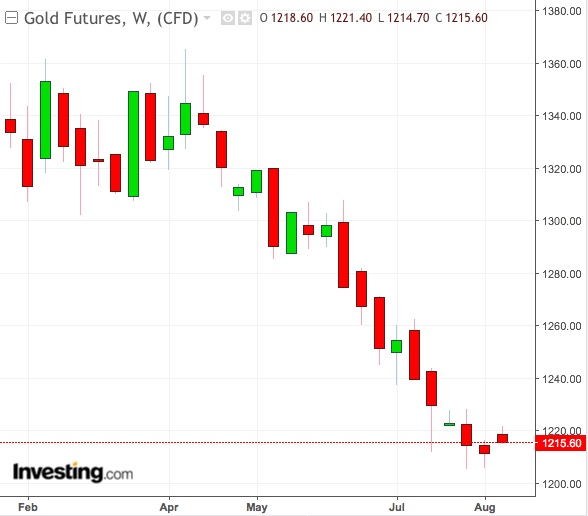
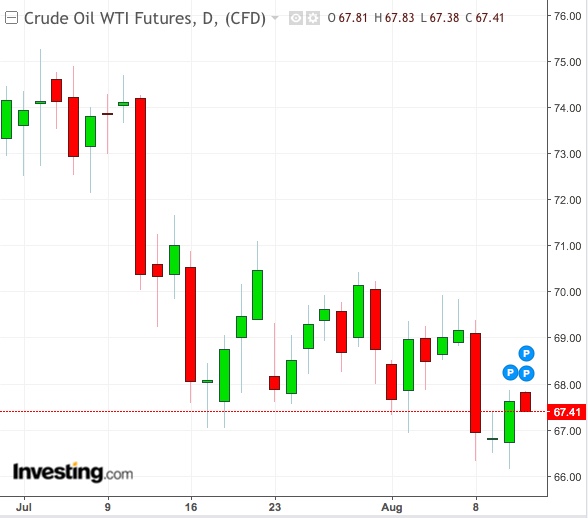
Gold bugs will battle to defend the yellow metal at the key $1,200 an ounce level this week as Turkey’s sanctions crisis diverts investors from commodities and other risk assets into the dollar. On the energy front, investors long on oil will hope the squeeze on Iranian supplies puts an end to crude’s worst losing streak in three years.
Elsewhere, grains prices are expected to turn volatile as more harvest damage from Europe’s drought squares off with the recent selling in wheat, soybeans and corn. US natural gas will be another interesting watch as investors mull whether prices look set to extend their rally from the thin supply builds for winter or turn lower as milder weather curbs cooling demand for the summer.
Turkey’s beleaguered lira should send more speculators toward the dollar, weighing on demand across commodities, forex dealers said. The dollar spiked 16 percent against the lira on Friday as the Trump Administration imposed sanctions on Ankara for the detention of American pastor Andrew Brunson in 2016. It also cautioned it will double tariffs on Turkish steel and aluminum.
“We're watching USD/TRY developments closely,” TD Securities said in a note issued Sunday. “Contagion risks are acute across markets. ECB concerns over bank exposures to Turkey and Italian budget woes have sent EUR/USD to fresh lows.”
Currency turmoil aside, markets will be on the lookout for an assortment of data on the calendar that includes US retail sales, China industrial output and UK inflation numbers, and Wall Street’s last week of earnings results.
Gold On Track For Fifth Straight Month In The Red
Gold, trailing the dollar as safe haven since March, has spent the past six weeks in the red. It will finish a fifth month in negative territory unless it makes a turnaround in August.

At Friday’s settlement, US gold futures’ most actively-traded December futures settled at $1,211.10 a troy ounce, with Investing.com’s daily technicals maintaining a “Sell” call. While Fibonacci patterns indicate Level 3 support at $1217.17 today, many who’ve witnessed bullion’s decline from January highs of $1,357.20 believe gold bears will attempt new lows in the risk-averse environment created by the lira.
Some think bullion would go higher if it had been oversold. But data on Friday from the Commodity Futures Trading Commission showed hedge funds and other big speculators were still shedding their bullish bets on US gold for a fourth straight week, reaching a 2015 low in net holdings.
“Traders are opting for ‘cash-is-king’ trades ”, abandoning bullion, said George Gero, precious metals analyst at RBC Capital in New York. “All this means is a dollar surge to highs not seen since 2017 that caps gold’s rally.”
Oil Market Split Over Consequences Of Iran Sanctions
US sanctions against Iran and the resultant hit on Tehran’s oil exports are likely to help crude prices come out of their biggest losing streak since 2015, some analysts said.

Both US West Texas Intermediate and UK Brent crude settled up on Friday, but the gains weren’t enough to prevent a fifth week of losses out of six.
At last week’s settlement of $67.63 a barrel, WTI is still a “Strong Sell” on Investing.com’s daily technicals, with Fibonacci readings placing first support at $67.65, second at $67.57 and third at $67.44.
Brent, which settled at $72.81, is also a “Strong Sell” by daily technicals, with Fibonacci support seen at $71.79, $71.37 and $70.71
The United States said last week it has started implementing new sanctions against Iran, which will also target the country's petroleum sector starting from November. One million barrels of Iran’s daily output, which stands at approximately 2.5 million barrels, could be at risk.
But with others in the Organization of the Petroleum Exporting Countries (OPEC) making up for the shortfall in Iranian oil exports, the sanctions on Tehran may not add up to much, Frankfurt-based Commerzbank said last week, adding that crude prices were probably justified at current or even lower levels.
Rising US oil output was also exacerbating worries about ample supplies. The US oil rig count surged 10 points last week, the most in a week since May. Total American crude production is nearly 16 percent above year ago levels.
“The market has been in an ongoing battle between those who view the production increase promised by OPEC and select non-OPEC producers to be enough to offset the many evolving geopolitical issues around the world” and those who don't, said Dominick Chirichella, analyst at EMI DTN in New York.
“Based on the performance of the market over the last six weeks, one must conclude that the production increasing view is winning the battle.”
