Let’s start with the caveats right away. Make no mistake about it, the trading method I am about to discuss is fraught with risk (DO NOT STOP READING!). To wit:
- *It is presently configured to maximize return not to minimize drawdowns
- *It uses a triple-leveraged bond ETF
- *Bonds have essentially been in a 30+ year bull market; bear market results may not be as good
So there’s all that. Still, the results are so compelling I have decided to pass them along and allow you to weigh the potential rewards and risks for yourself.
(See also Seasonality in the Bond Market? You Bet)
The Framework
Part 1 – Ticker TMF
*For all tests we are using Direxion Daily 20+ Year Treasury Bull 3X Shares (NYSE:TMF) which tracks the daily performance of the 30-Year T-bond times 3.
*The results of all tests run from 4/16/2009 (when TMF started trading) through 9/20/2016 (although the original backtesting used t-bond futures data which goes back to 1978).
*For the purposes of these tests, no interest is assumed to be earned while out of TMF.
Part 2 – Ticker EWJ
In this article I wrote about the potential for using iShares MSCI Japan ETF (NYSE:EWJ) as a timing tool for bonds (no, seriously). In a nutshell:
- *It is bullish for bonds when the 5-week moving average for EWJ is BELOW the 30-week moving average for EWJ.
- *It is bearish for bonds when the 5-week moving average for EWJ is ABOVE the 30-week moving average for EWJ.
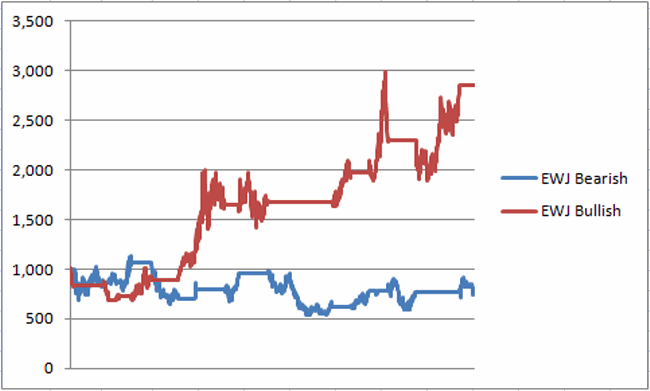
Figure 1 displays the growth of $1,000 invested in TMF when EWJ is bullish for bonds (red line) versus bearish for bonds (blue line)
Figure 1 – Growth of $1,000 invested in TMF if EWJ indicator is bullish (red line) versus if EWJ indicator is bearish (blue line)
For the record:
*$1,000 invested in TMF when EWJ is bullish grew to $2,854
*$1,000 invested in TMF when EWJ is bearish shrank to $759
*Average 12-mo. TMF return when EWJ is bullish = +22.2%
*Average 12-mo. TMF return when EWJ is bearish = +1.4%
*Maximum drawdown for TMF when EWJ is bullish = (-36.6%)
*Maximum drawdown for TMF when EWJ is bearish = (-52.7%)
Part 3 – Trading Days of the Month
In this article I wrote about the performance of t-bonds during the last 5 trading days of the month versus all other trading days (again, no, seriously). In a nutshell:
*The last 5 trading days of the month are considered bullish for bonds.
*All other trading days of the month are considered bearish for bonds.
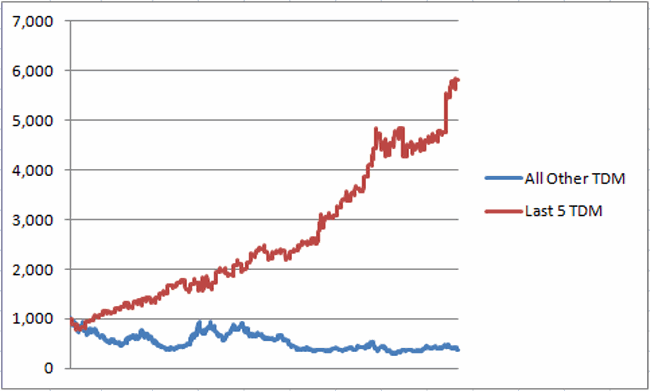
Figure 2 displays the growth of $1,000 invested in TMF only during the last five trading days of every month (red line) versus all other trading days (blue line)

Figure 2 – Growth of $1,000 invested in TMF during last 5 trading days of month (red line) versus all other trading days of month (blue line)
For the record:
*$1,000 invested in TMF last 5 trading days of every month grew to $5,811
*$1,000 invested in TMF last 5 trading days of every month shrank to $373
*Average 12-mo. TMF return holding last 5 trading days of month = +28.2%
*Average 12-mo. TMF return holding all other days of month = (-2.6%)
*Maximum drawdown holding TMF last 5 trading days of month = (-22.9%)
*Maximum drawdown holding TMF all other days of month = (-71.5%)
Putting the Two “Models” Together
So here is the finished product – Jay’s Very Risky Bond Model (JVRBM):
Bullish for TMF if:
*EWJ 5-week MA < EWJ 30-week MA
OR
*Today is one of the last 5 trading days of the month
Bearish for TMF if:
*EWJ 5-week MA > EWJ 30-week MA
AND
*Today is NOT one of the last 5 trading days of the month
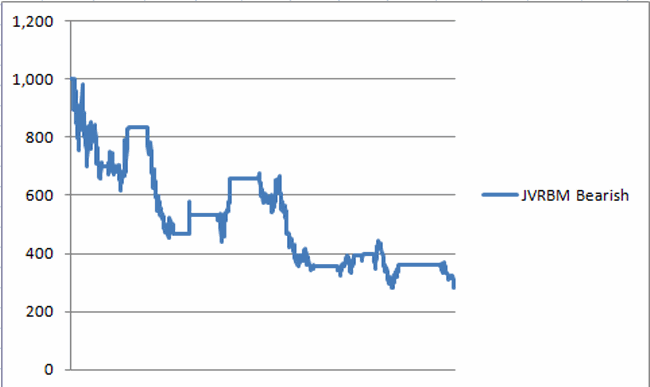
Figure 3 displays the growth of $1,000 invested in TMF only when JVRBM is bearish.
Figure 3 – Growth of $1,000 invested in TMF only when EWJ indicator is bearish AND today is NOT one of the last 5 trading days of the month
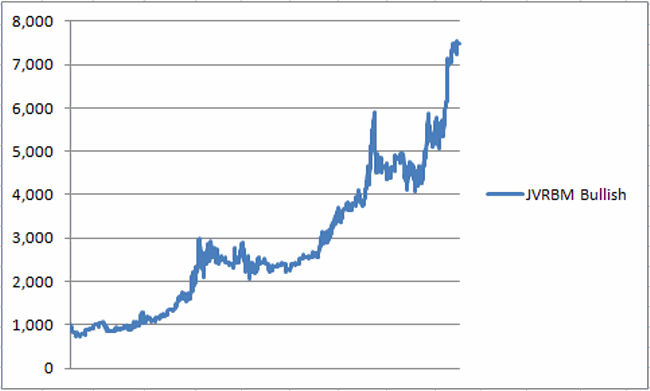
Figure 4 displays the growth of $1,000 invested in TMF only when JVRBM is bullish.
Figure 4 – Growth of $1,000 invested in TMF only when EWJ indicator is bearish AND today is NOT one of the last 5 trading days of the month
Anyone notice a difference?
For the record:
*$1,000 invested in TMF when JVRBM is bullish grew to $7,497
*$1,000 invested in TMF when JVRBM is bearish shrank to $289
*Average 12-mo. TMF return when JVRBM is bullish = +36.8%
*Average 12-mo. TMF return when JVRBM is bearish = (-8.5%)
*Maximum drawdown for TMF when JVRBM is bullish = (-30.9%)
*Maximum drawdown for TMF when JVRBM is bullish = (-71.9%)
Summary
This is a classic example of a high/risk/high reward strategy. The mistake that too many people make in this situation is to look at the potential returns and to get stars (er, dollar signs) in their eyes, which causes them to mentally downplay the risk side of the equation.
In this backtest, the JVRBM strategy generated a maximum drawdown of -30.9%. That is the figure that any trader should think long and hard about before ever contemplating taking any real-world action.
