For those who are willing to see it, there is strong evidence that reasonably persistent seasonal trends exist in the stock market (see here).
But what about the bond market? Do seasonal trends exist there?
Consider the following and decide for yourself.
Junk vs. GNMA
“Junk” bonds (more tactfully referred to as “high-yield” bonds) are issued by companies with less than a top-flight credit rating and pay a higher rate of interest than investment-grade corporate bonds in order to compensate for the fact that junk bond issuers are more likely to default than investment grade companies.
To track this segment we will use Vanguard High Yield Corporate (ticker VWEHX).
GNMA bonds are mortgaged-backed securities. For the record, yes I know that after the housing credit meltdown in 2008 most people reflexively recoil in horror at the mere mention of the phrase “mortgage-backed securities” (see, there you go again), but not to worry, the fund that we will use is the Vanguard GNMA Fund (ticker VFIIX), which deals only with government-backed GNMA’s (OK, yes I also realize that to a lot of people the phrase “government-backed” doesn’t hold quite the same meaning it used to. But hey, we are just running a hypothetical test here people, can we please just move along now? And just or the record, ticker VFIIX GAINED +7.2% in 2008).
The Test
For our test we will hold these two funds as follows:
*December through April hold VWEHX
*May through November hold VFIIX
We will also consider what would happen if we held the two funds separately and bought and held both funds.
For all tests we will use monthly total return data from PEP by Callan Associates starting in July 1980.
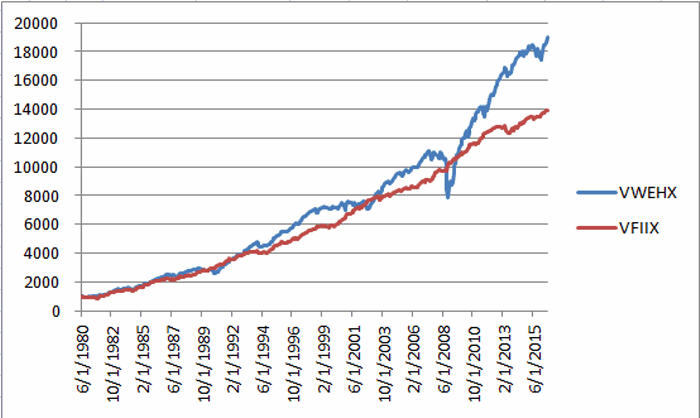
Figure 1 displays the growth of $1,000 achieved by simply buying and holding VWEHX and VFIIX since July 1980. Through July 2016 $1,000 in VWEHX grew to $19,019 and $1,000 in VFIIX grew to $13,917. Using monthly total return data VWEHX has a maximum drawdown of -28.9% and VFIIX a maximum drawdown of -12.5%.
Figure 1 – Growth of $1,000 in VWEHX and VFIIX (6/30/80-7/31/2016)
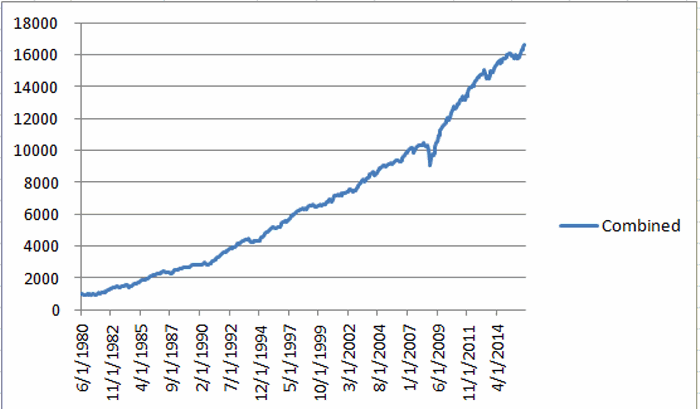
Figure 2 displays the growth of $1,000 split evenly between VWEHX and VFIIX. The combined portfolio grew to $16,620 with a maximum drawdown of -13.5%
Figure 2 – Growth of $1,000 split evenly between VWEHX and VFIIX (6/30/80-7/31/2016)
Now let’s apply our switching strategy and holding VWEHX only during December through April and VFIIX only during May through November.
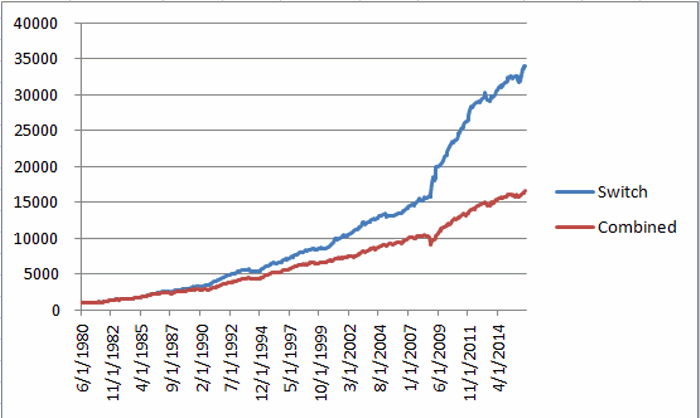
Figure 3 displays the result generated using this strategy versus splitting money evenly between the two funds on a buy and hold basis.
Figure 3 – Growth of $1,000 using Jay’s Switching System (blue line) versus buying and holding both VWEHX and VFIIX (red line); 6/30/80-7/31/2016
$1,000 invested using the switching system grew to $34,016 versus $16,620 for buying and holding both funds. The maximum drawdown for the switching system was -9.3% versus -13.5% for buy-and-hold.
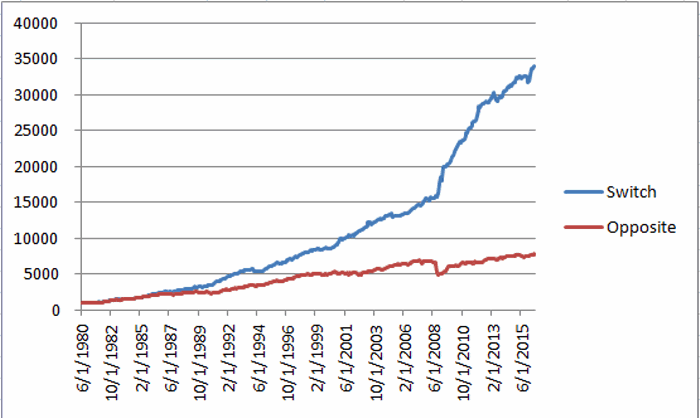
Finally, to drive home the point about seasonality, consider the results if we did opposite. Lastly Figure 4 displays the returns for the switching strategy versus doing the exact opposite, i.e., holding VFIIX during December through April and VWEHX from May through November.
Figure 4 – $1,000 invested using Jay’s Switching System (blue line) versus doing the exact opposite (red line); 6/30/80-7/31/2016
$1,000 invested using the switching system grew to $34,016 and had a maximum drawdown of -9.3%. Doing the exact opposite would have seen $1,000 grow to just $7,781 with a maximum drawdown of -28.6%.
Summary
So is this system the “Be All, End All” when it comes to bonds? Not at all. There are other useful bond strategies. If and when interest rates once again rise, most all bond specific trading strategies will face much greater challenges than they have in the past 35 years.
But the point of this piece is not so much to tout a particular system but to alert you to the fact that simple seasonal trends – most of which are hiding in plain sight for those who are willing to recognize them – can offer investors a unique edge.


