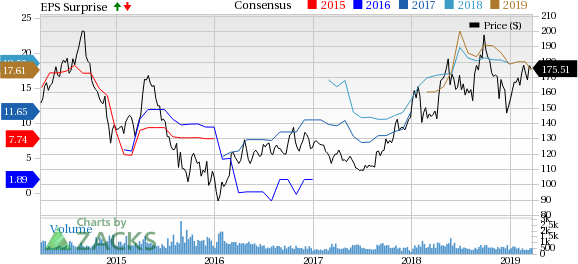
CNOOC Limited (NYSE:CEO) recently announced 2018 annual results. The company’s basic earnings per share in full-year 2018 were RMB1.18, reflecting a 113% increase from the 2017 level. Net profit from operations surged from RMB24.7 billion in 2017 to 52.7 billion in 2018.
Oil and gas sales revenues in full-year 2018 were RMB185.9 billion, 22.4% higher than the year-ago level of 151.9 billion. The upside can be attributed to increased production and rise in price realizations.
Production Rise
In 2018, CNOOC’s net production was 475 million barrels of oil equivalent (MMBoe), up marginally from the year-ago level of 470.2 MMBoe. The production figure was within the 470-480 MMBoe production target that was set at the beginning of the year. Of the total production, 65% came from China and overseas contributed the rest. While total crude and liquids production fell 1.3% through 2018 to 383.5 million barrels, natural gas output increased 12% during the period to 530.2 billion cubic feet.
Increased Price Realizations
The company’s average realized oil price increased 27.7% year over year to $67.22 per barrel. Realized gas price increased 9.8% from the year-ago level to $6.41 per thousand cubic feet.
Decreasing All-in Cost
During 2018, the company managed to reduce all-in cost to $30.39 per Boe, 6.6% lower than 2017 levels. The decline was primarily observed in DD&A expenses. Notably, the company has decreased all-in cost per Boe for five years in a row.
Capital Expenditure Hike
In 2018, CNOOC’s capital expenditure was RMB62.6 billion, higher than the 2017 level of RMB50.1 billion. For exploration, development and production purposes, the company used RMB12.3 billion, RMB37.4 billion and RMB12.4 billion, respectively.
Reserves Growth
In 2018, the company’s reserve replacement ratio was 126%. At the end of 2018, its net proved reserves grew to a historic high of 4.96 billion Boe. Moreover, the company’s reserve life has been extended to 10.5 years.
Upbeat Guidance
The company expects 2019 capital expenditure in the range of RMB70-80 billion. Production for full-year 2019 is anticipated in the 480-490 MMBoe band. Through 2019, CNOOC expects its reserve replacement ratio to be 120%. It expects six new projects to come online in 2019.
Our Take
We remain optimistic on CNOOC as its performance is reflective of its premium asset portfolio, excellent execution strategy and unique position as a pure oil play. During the year, CNOOC made 17 commercial discoveries, and successfully completed the appraisal of 17 oil and gas structures. The company has more than 20 new projects under construction, of which six are expected to come on stream this year.
Zacks Rank and Other Stocks to Consider
CNOOC currently holds a Zacks Rank #2 (Buy). Investors interested in the energy sector can opt for other top-ranked stocks as given below:
Denver, CO-based Antero Resources Corporation (NYSE:AR) is an upstream energy company. Its top line for 2019 is expected to increase 11.8% year over year. The stock currently has a Zacks Rank #1 (Strong Buy). You can see the complete list of today’s Zacks #1 Rank stocks here.
Rio de Janeiro, Brazil-based Petróleo Brasileiro S.A. or Petrobras (NYSE:PBR) is an integrated energy company. Its top line for 2019 is expected to increase 9.1% year over year. The stock currently has a Zacks Rank #2.
El Dorado, AR-based Murphy Oil Corporation (NYSE:MUR) is an exploration and production company. For 2019, its bottom line, which has witnessed three upside revisions over the past 60 days, is expected to grow 7.9% year over year. The company currently holds a Zacks Rank #2.
Today's Best Stocks from Zacks
Would you like to see the updated picks from our best market-beating strategies? From 2017 through 2018, while the S&P 500 gained +15.8%, five of our screens returned +38.0%, +61.3%, +61.6%, +68.1%, and +98.3%.
This outperformance has not just been a recent phenomenon. From 2000 – 2018, while the S&P averaged +4.8% per year, our top strategies averaged up to +56.2% per year.
See their latest picks free >>
CNOOC Limited (CEO): Free Stock Analysis Report
Petroleo Brasileiro S.A.- Petrobras (PBR): Free Stock Analysis Report
Antero Resources Corporation (AR): Free Stock Analysis Report
Murphy Oil Corporation (MUR): Free Stock Analysis Report
Original post
Zacks Investment Research

