The securities exchange industry is, of late, characterized by improving trading volumes. This in turn will help improve the clearing and transaction fees. The players in the industry have been witnessing expansion in their average daily volumes. Consolidations have been helping companies retain their market shares.
Companies stand to benefit from their expansive product offering, prudent expense management, operating leverage and higher listings.
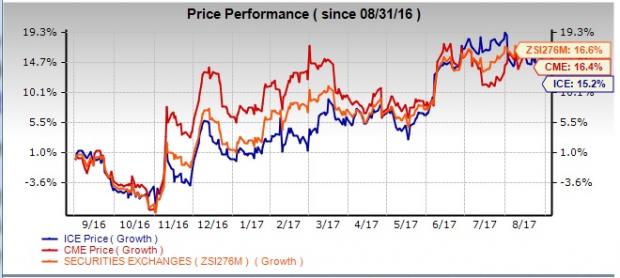
Though the securities exchange industry is currently ranked at #194 (lies at the bottom half of the Zacks Industry Rank for 267 industries), it has outperformed the S&P 500 in a year by registering a 16.9% rally. The index on the other hand has climbed 12.0%.
.jpg)
Here we focus on two securities exchanges. Intercontinental Exchange, Inc. (NYSE:ICE) , with a market capitalization of $38.2 billion, operates a network of global futures, equity and equity options exchanges as well as global clearing and data services throughout financial and commodity markets. Whereas CME Group (NASDAQ:CME) , with a market capitalization of $43.0 billion, is the largest futures exchange in the world in terms of trading volumes as well as notional value traded.
Both stocks carry a Zacks Rank #3 (Hold). It will be interesting to note which stock is better positioned in terms of fundamentals.
Some better-ranked stocks from the finance sector are Green Dot Corp. (NYSE:GDOT) and Atlas Financial Holdings, Inc. (NASDAQ:AFH) , flaunting a Zacks Rank #1 (Strong Buy). You can see the complete list of today’s Zacks #1Rank stocks here.
Price Performance
Shares of both CME Group and Intercontinental Exchange lagged the industry in a year. While gained 16.4%, Intercontinental Exchange gained 15.2%. On a comparative analysis, CME Group has an edge over Intercontinental Exchange.

Valuation
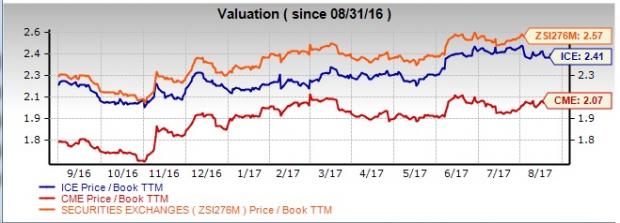
The price-to-book value metric is the best multiple, used for valuing an exchange. Compared with the securities exchange industry’s P/B ratio of 2.57, both Intercontinental Exchange and CME Group are underpriced with a reading of 2.41 and 2.07, respectively. This round goes to CME Group as the company’s shares are cheaper than the Intercontinental Exchange, thus making it more affordable to potential investors.
Return on Equity
Intercontinental Exchange has higher return on equity compared with the industry average of 9.66%. The company with a return on equity of 10.46% has an edge over CME Group’s 7.58%. Hence, Intercontinental Exchange scores over CME Group in this round..jpg)
Dividend Yield
CME Group’s dividend yield is 2.03%, more than the industry average of 1.59%. However, Intercontinental Exchange’s yield is 1.23%, lagging the industry average. Comparatively, CME Group has an edge over Intercontinental Exchange. A company with more dividend yield makes it an attractive pick for yield-seeking investors.
Earnings Surprise History
In terms of the companies’ surprise history, Intercontinental Exchange has surpassed the Zacks Consensus Estimate in three of the last four quarters with an average beat of 0.99%. Whereas, CME Group delivered positive surprises in the last four quarters with a four-quarter average beat of 2.19%.
CME Group has a visible edge over Intercontinental Exchange.
Earnings Estimate Revisions and Growth Projections
CME Group’s estimates have inched up 0.2% for 2017 and 1.3% for 2018 in the last 60 days. On the other hand, Intercontinental Exchange estimates slid nearly 3% for 2017 and 0.9% for 2018 over the same time frame.
For CME Group, the Zacks Consensus Estimate for earnings per share is $4.85 for 2017, reflecting a year-over-year increase of 7.10%. For 2018, the Zacks Consensus Estimate for earnings per share is pegged at $5.31, representing a year-over-year rise of 9.34%. CME Group has long-term expected earnings per share growth of 10.6%.
For Intercontinental Exchange, the Zacks Consensus Estimate for earnings per share is $2.94 for 2017, reflecting a year-over-year increase of 5.87%. For 2018, the Zacks Consensus Estimate for earnings per share is pegged at $3.33, representing a year-over-year rise of 13.03%. Intercontinental Exchange has long-term expected earnings per share growth of 11%.
This round weighs equally for both.
To Conclude
Our comparative analysis shows CME Group to have an edge over Intercontinental Exchange with respect to price performance, valuation, dividend yield and earnings surprise history. While Intercontinental Exchange performs better over CME Group on return on equity parameter.
Overall, CME Group therefore has a clear advantage over Intercontinental Exchange.
4 Surprising Tech Stocks to Keep an Eye On
Tech stocks have been a major force behind the market’s record highs, but picking the best ones to buy can be tough. There’s a simple way to invest in the success of the entire sector. Zacks has just released a Special Report revealing one thing tech companies literally cannot function without. More importantly, it reveals 4 top stocks set to skyrocket on increasing demand for these devices. I encourage you to get the report now – before the next wave of innovations really take off. See Stocks Now>>
Atlas Financial Holdings, Inc. (AFH): Free Stock Analysis Report
Intercontinental Exchange Inc. (ICE): Free Stock Analysis Report
CME Group Inc. (CME): Free Stock Analysis Report
Green Dot Corporation (GDOT): Free Stock Analysis Report
Original post
Zacks Investment Research
