Shares of CME Group Inc. (NASDAQ:CME) gained 2.4% in the last trading session after it reported average daily volume (ADV) for August. ADV of 16 million contracts per day improved 16% year over year. Of this, Options volume surged 30% year over year to average 3.1 million contracts per day, while electronic options soared 51% year over year and averaged 2.2 million contracts per day. The company witnessed increase in ADV in all six product lines.
Metals volume of 0.6 million contracts per day increased 50%, whereas Energy volume of 2.8 million contracts rallied 25%. Interest rate volume of 7.8 million contracts per day rose 10%, Equity index volume of 2.7 million increased 15% and Foreign exchange volume improved 29% to about 0.8 million. Agricultural volume of about 1.5 million contracts per day increased 18% year over year.
Recently, securities exchanges namely, CBOE Holdings Inc. (NASDAQ:CBOE) , Intercontinental Exchange, Inc. (NASDAQ:NDAQ) and MarketAxess Holdings Ltd. (NASDAQ:MKTX) also posted their August volumes.
CBOE Holdings’ ADV increased 33% to 7.4 million contracts per day, while Intercontinental Exchange witnessed a 12% increase in ADV to 4.6 million contracts. MarketAxess’ monthly trading volume for August was $114.3 billion.
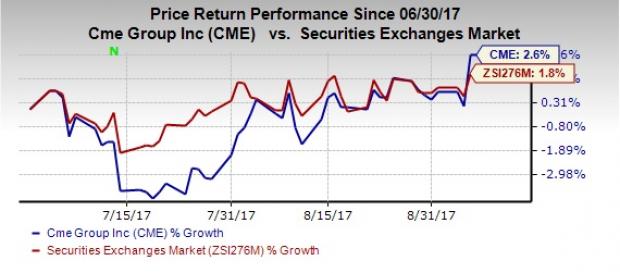
Shares of CME Group have outperformed the industry quarter to date. While the stock has gained 2.6%, the Securities Exchanges industry registered a 1.8% rise.

CME Group’s improving volumes are driven by a solid operating leverage, helping it maintain an enormous market share. The company holds about 90% market share of the global futures trading and clearing services. Expansion of futures products in emerging markets, plus increase in non-transaction related opportunities and OTC offerings should continue to contribute modestly to the top-line growth in years ahead. Efforts to expand and cross-sell through strategic alliances, acquisitions, new product initiatives as well as global presence should also drive growth.
Zacks Rank
CME Group presently carries a Zacks Rank #3 (Hold). You can see the complete list of today’s Zacks #1 Rank (Strong Buy) stocks here.
One Simple Trading IdeaSince 1988, the Zacks system has more than doubled the S&P 500 with an average gain of +25% per year. With compounding, rebalancing, and exclusive of fees, it can turn thousands into millions of dollars. This proven stock-picking system is grounded on a single big idea that can be fortune shaping and life changing. You can apply it to your portfolio starting today. Learn more >>
CME Group Inc. (CME): Free Stock Analysis Report
Nasdaq, Inc. (NDAQ): Free Stock Analysis Report
CBOE Holdings, Inc. (CBOE): Free Stock Analysis Report
MarketAxess Holdings, Inc. (MKTX): Free Stock Analysis Report
Original post
Zacks Investment Research
