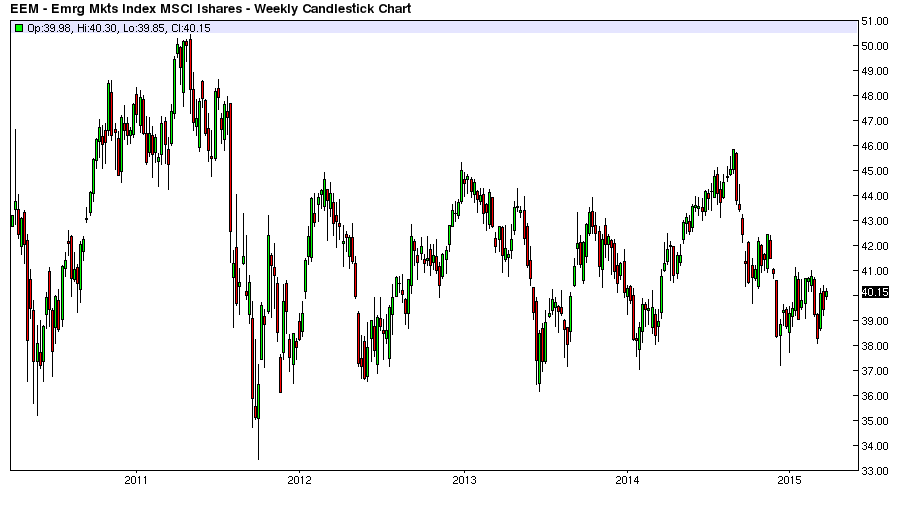
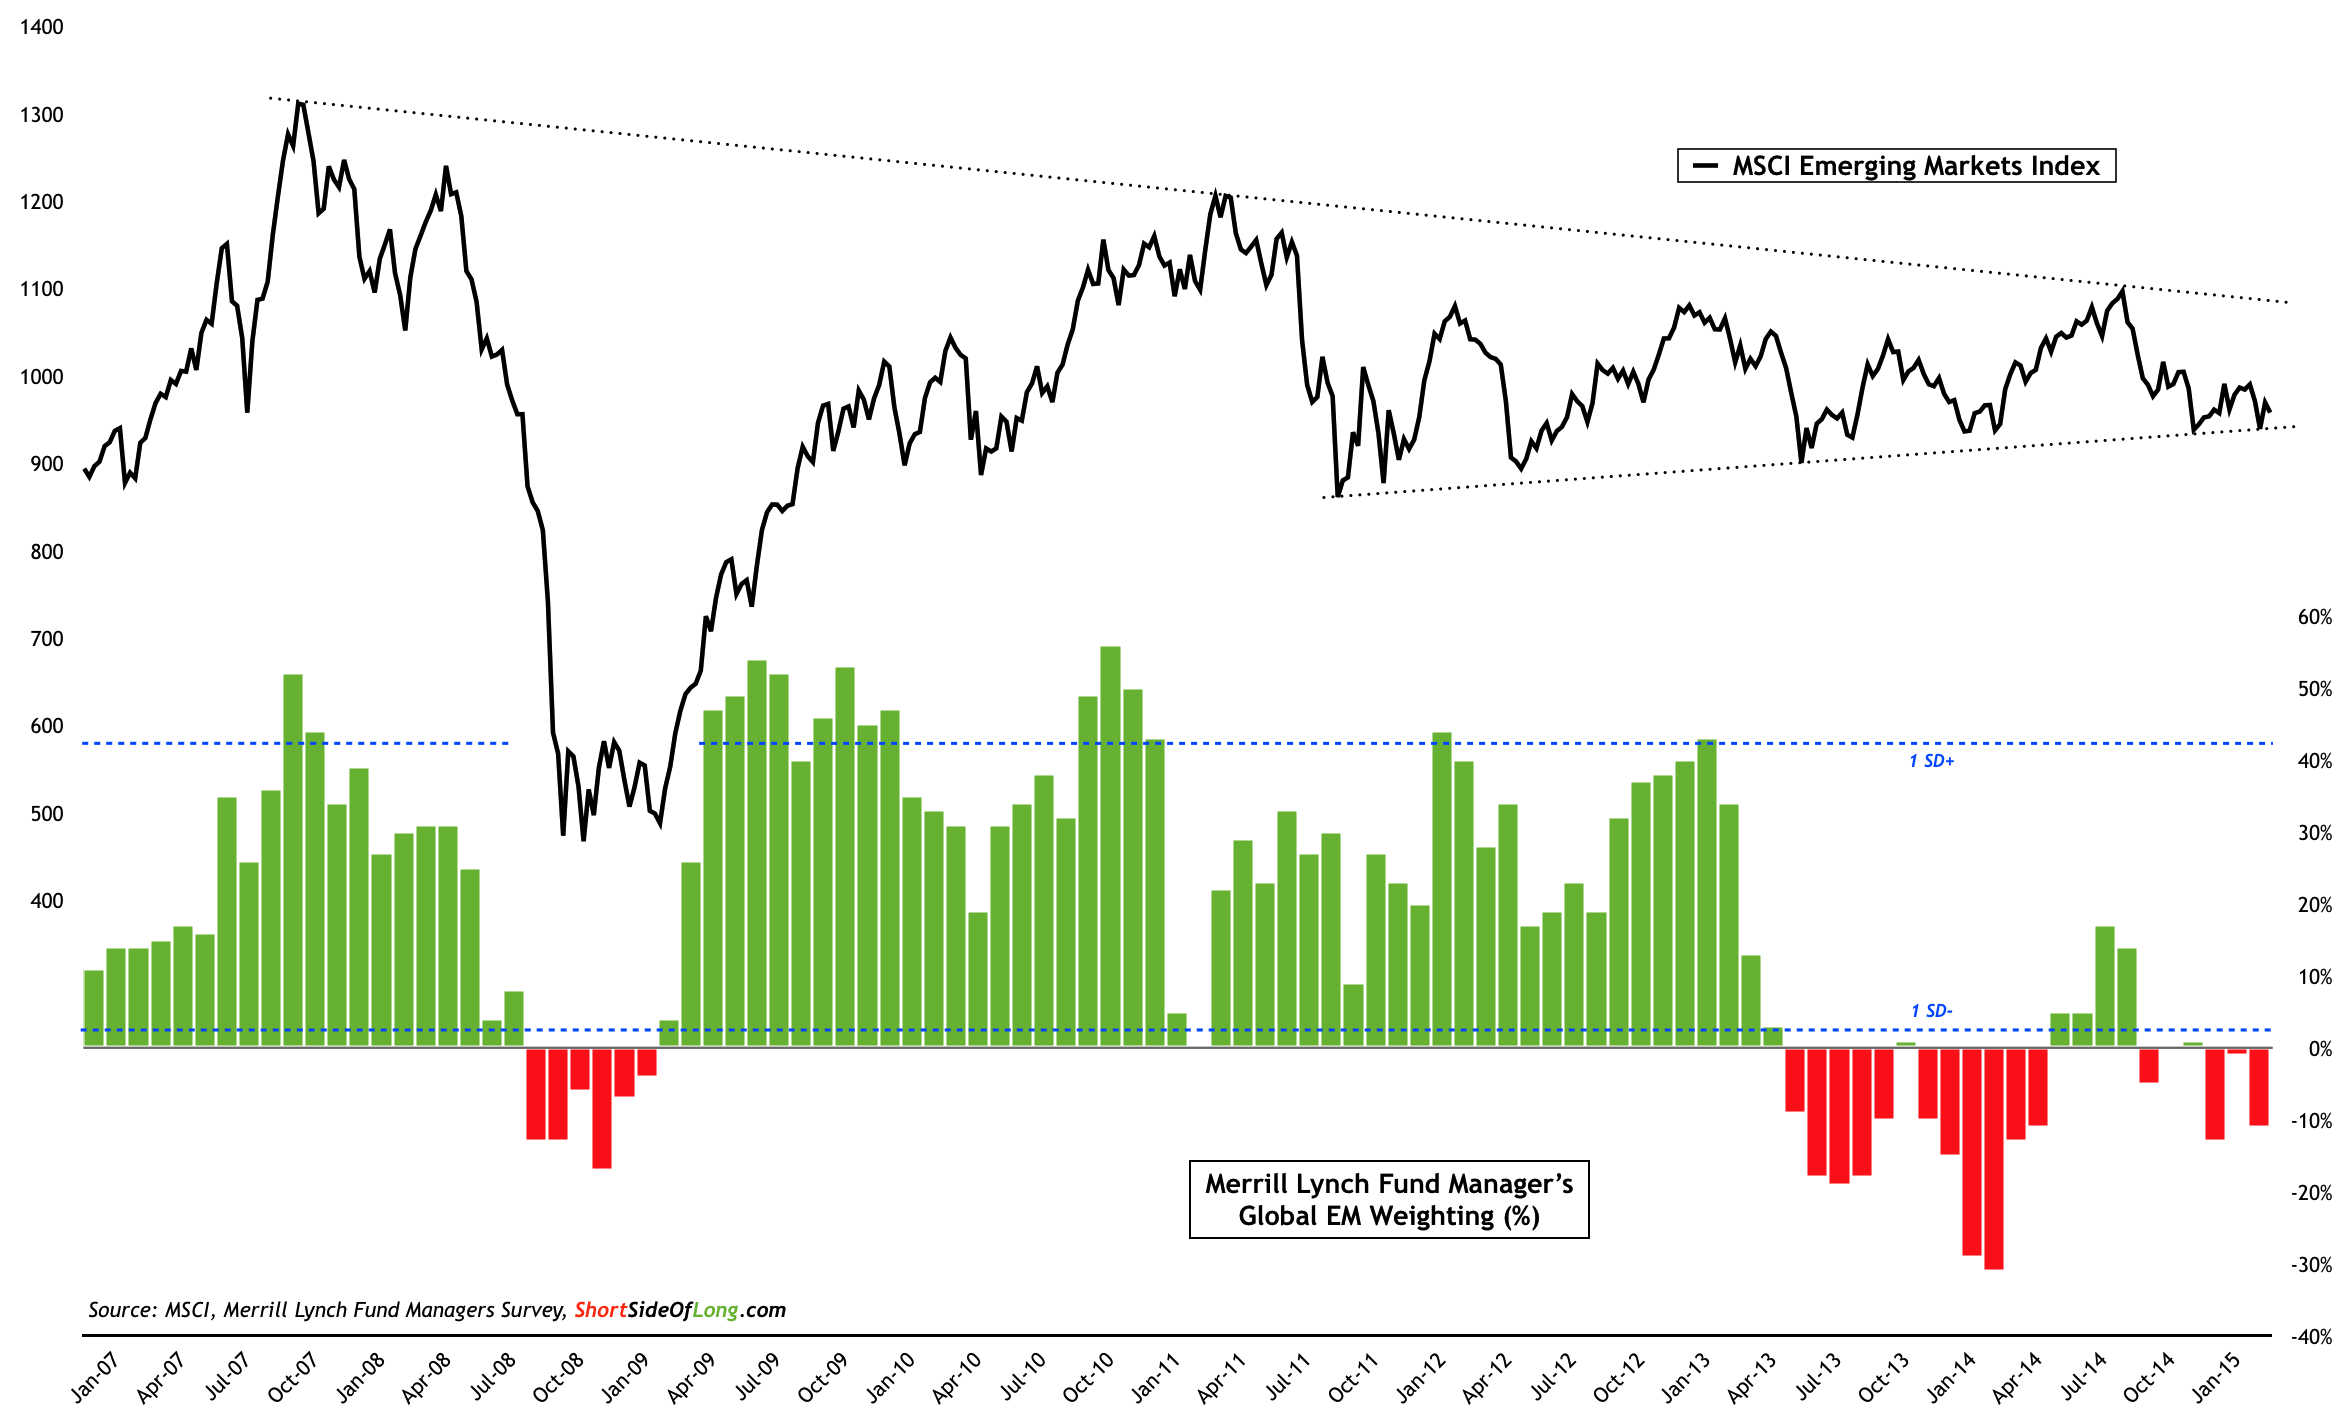
Some regular readers might remember that Emerging Markets equities (via iShares MSCI Emerging Markets (ARCA:EEM)) have caught my attention for several months now (refer to Chart 1). By and large, the index has been trend-less for a number of years and to be quite precise, it trades at the same level it did in September 2009 (without dividends).
Let us also remember that the NBER officially declared the end of the US recession in June of 2009. So the question is: if world growth hasn't been contracting (i.e. recession), why are emerging market equities still trading at levels from around six years ago? Let us investigate further.
Chart 1: By and large EM equities have been trend-less for years now
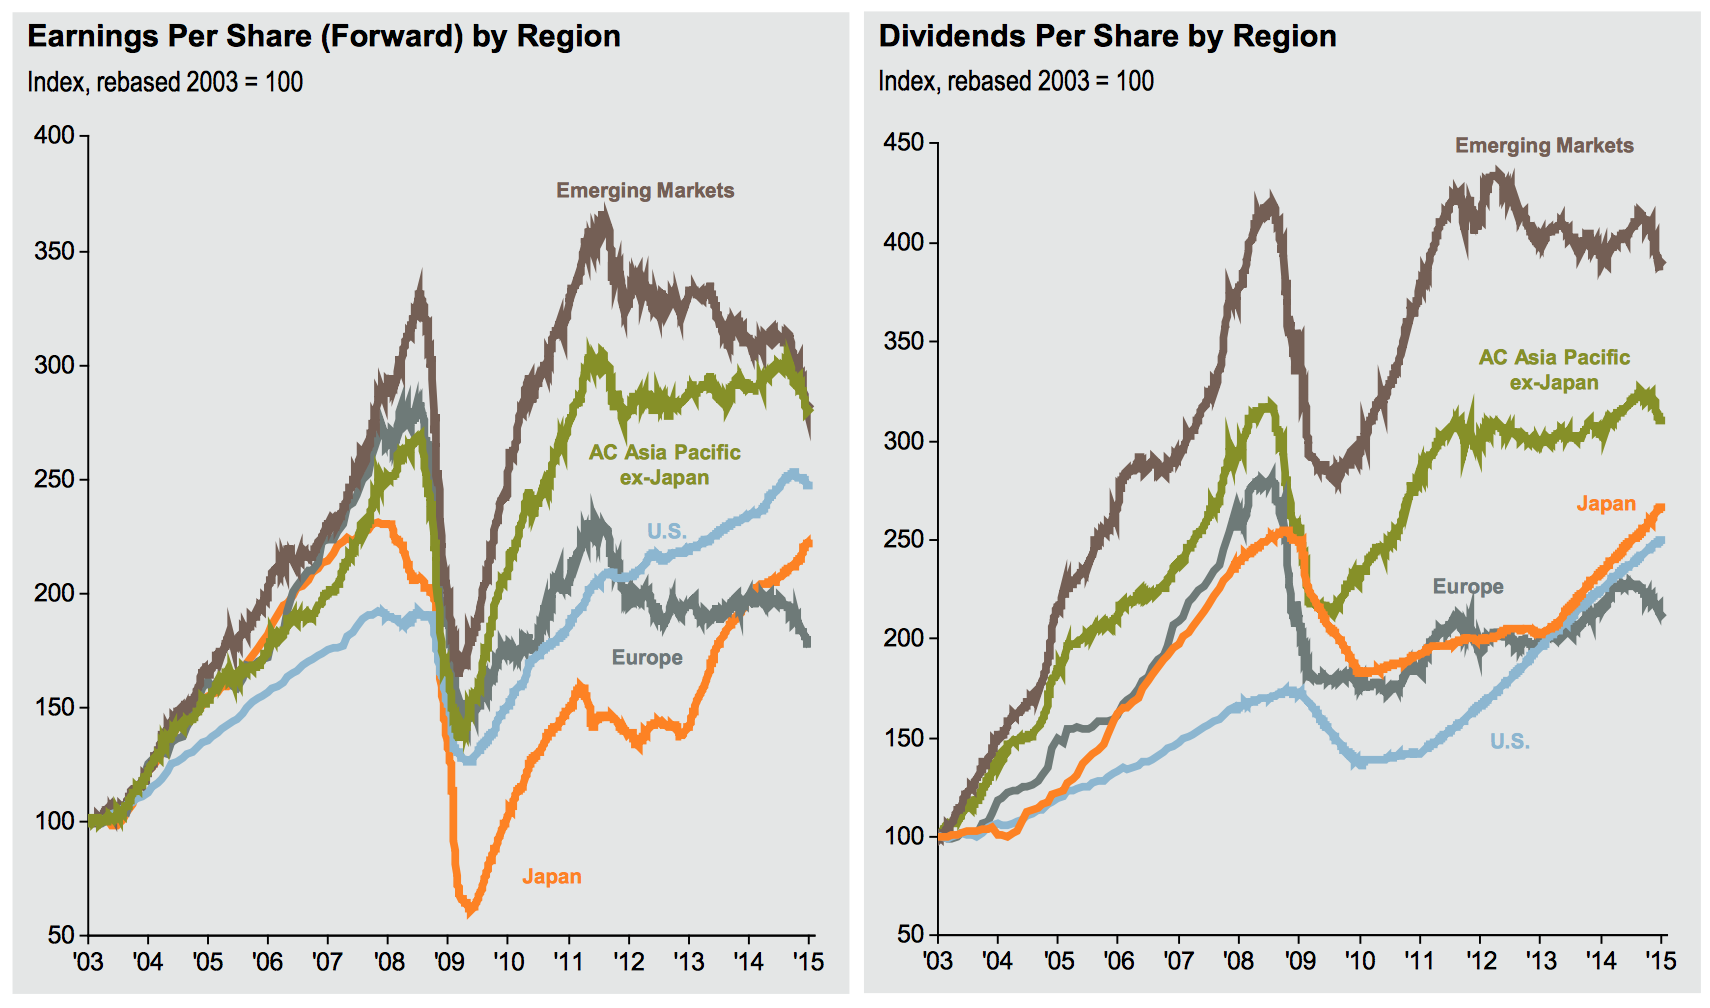
The recovery coming out of the depths of the Global Financial Crisis of 2008 was quite synchronised around the world. We should be able to observe very clearly how all major regions (US, EU, Japan and EMs) had a similar rebound in earnings per share from early 2009 into early parts of 2011 (refer to Chart 2).
However, around the middle of 2011 the infamous "risk on / risk off" correlations broke down, catching many traders by surprise. Basically, every equity market or region started to perform based on its own merits and when I say merits, I am talking about ludicrous monetary policies and easy money conditions by central banking geniuses. Some central banks were early in the easing game, while others are playing catch up only now.
Chart 2: EM under-performance is linked to disappointment in earnings
If we look at Chart 2 again, we can see that the recent rise in earnings by US and Japanese companies is connected to the Federal Reserve's and Bank of Japan's latest rounds of quantitative easing (started around late 2012). One could assume a similar outcome is to follow in Europe, as EPS growth picks up in coming quarters. Obviously, we have to give our thanks to Mario Draghi, who has finally decided to engage in similar policies already imposed by other major central banks.
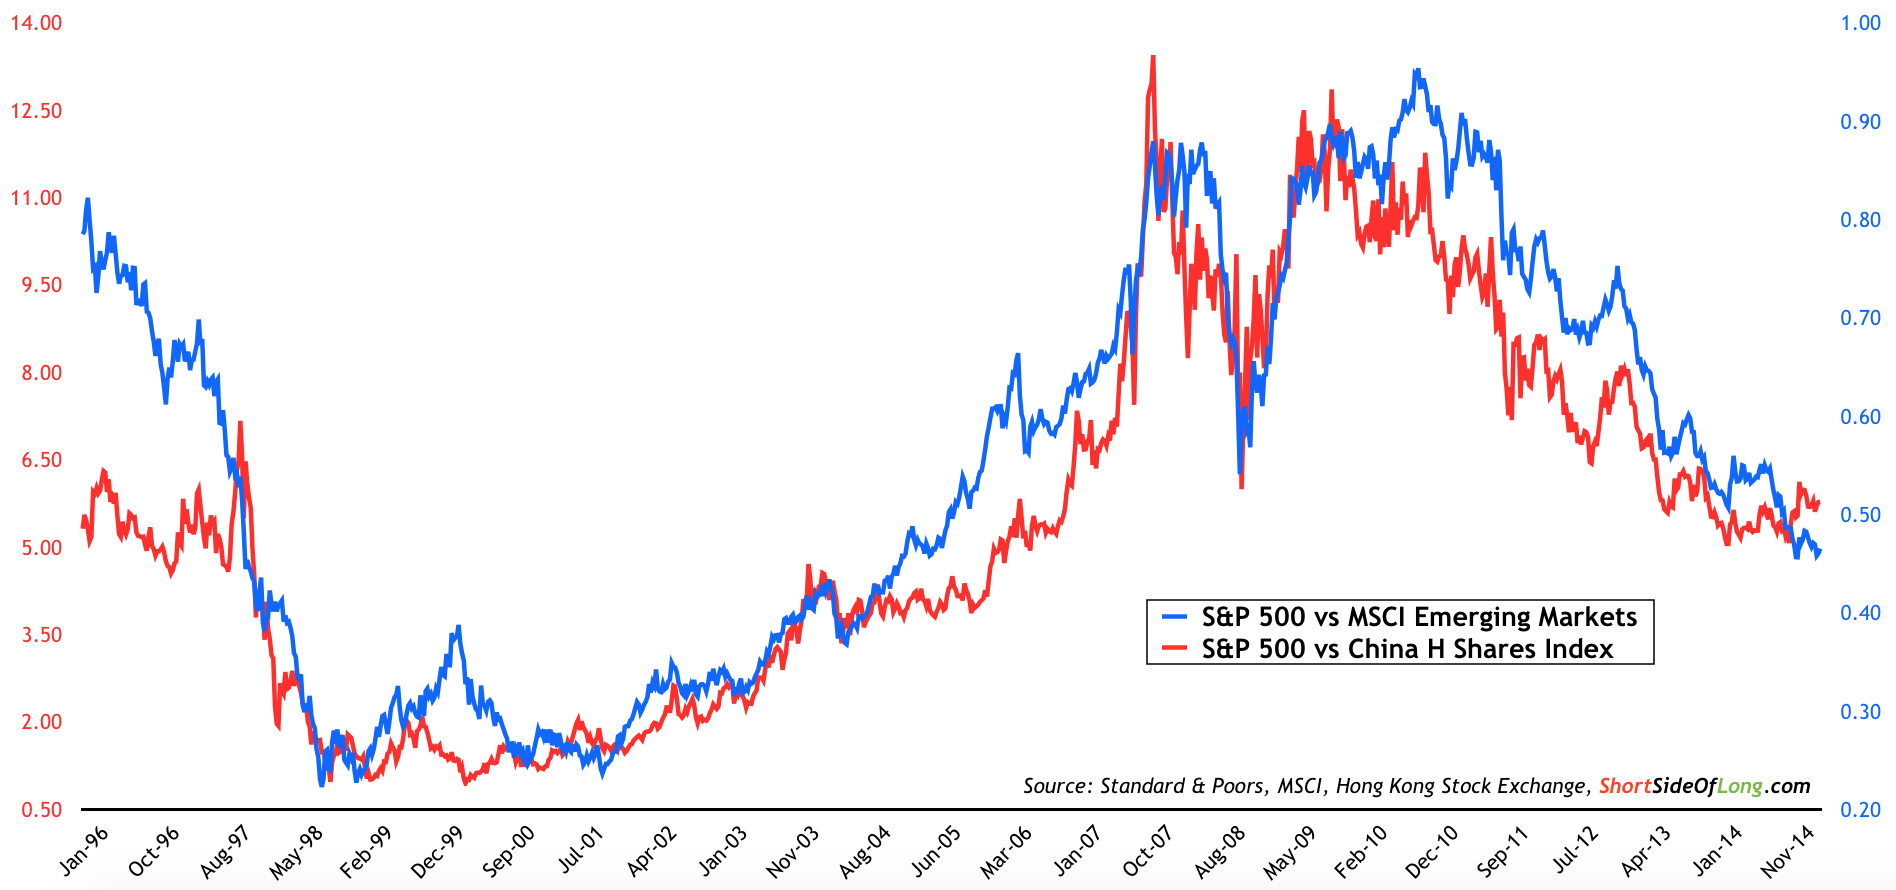
So, whereas developed markets march upwards as already explained, emerging markets have remained trend-less in nominal terms and therefore under-performed markets such as the US by a large margin (refer to Chart 3). The relative under-performance has been rather sharp since late 2010. From a contrarian perspective, could we see a turnaround here?
Chart 3: A reason why EM equities have under-performed DM equities
It is still to early to say. We have to consider the fact that during the late 1990s, in the midst of the Asian Financial Crisis and the Russian Debt Default, emerging markets under-performed by an even larger degree. Could this happen again? Of course it could. Markets always tend to overshoot in either direction. As already discussed from Chart 2, EM earnings have been weak for a number of years. So to see any type of relative out-performance, we would have to see an EPS turnaround.
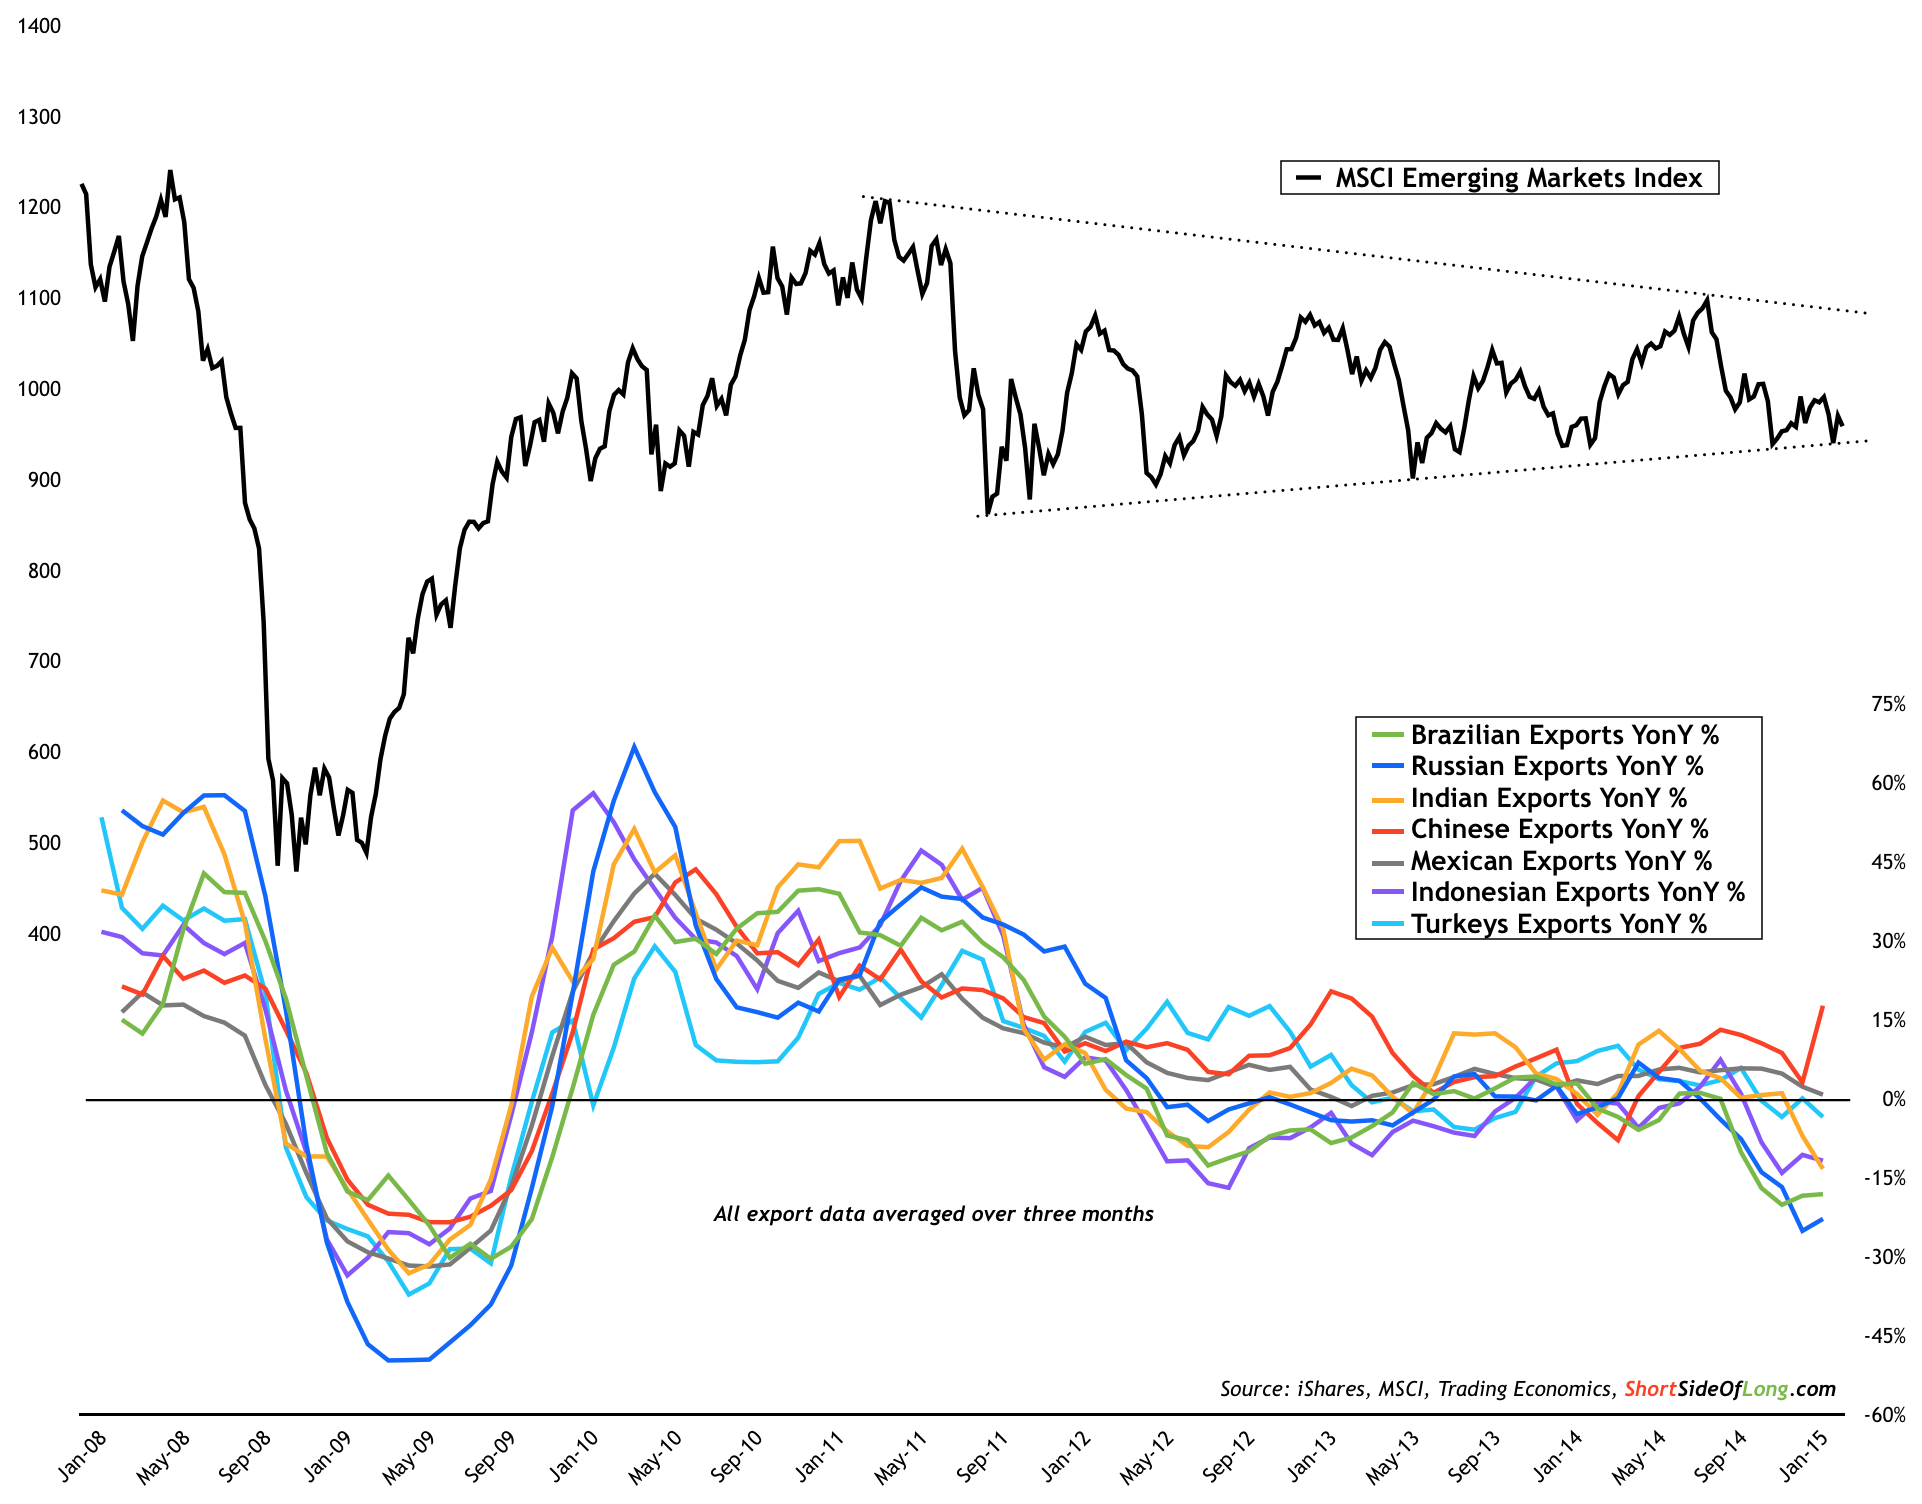
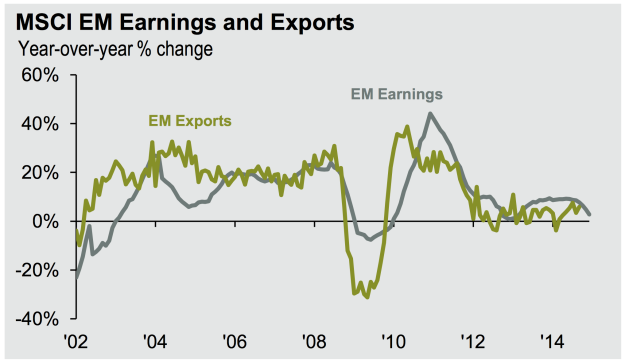
Dr. David Kelly and his the lovely research team over at JP Morgan do a great job illustrating how emerging market economies are still heavily dependent and modeled towards exports. It is exports that drive EM corporate earnings and as export growth remains quite flat or even contracts (refer to both Chart 4 and 5), the earnings outlook could remain disappointing in the near future.
Chart 4: Disappointment in earnings correlates closely to weak exports
Source: JP Morgan
Chart 5: Export weakness has been widespread within the E7 economies
Averaged over three months, just about all the economies in the so called "Emerging 7" have contracting export growth. Russia and Brazil are feeling the brunt of the pain as commodity prices, and especially Crude Oil, have crashed since summer of 2014. China seems to be the odd duckling, reporting export growth of almost 50% in February, compared to same time last year.
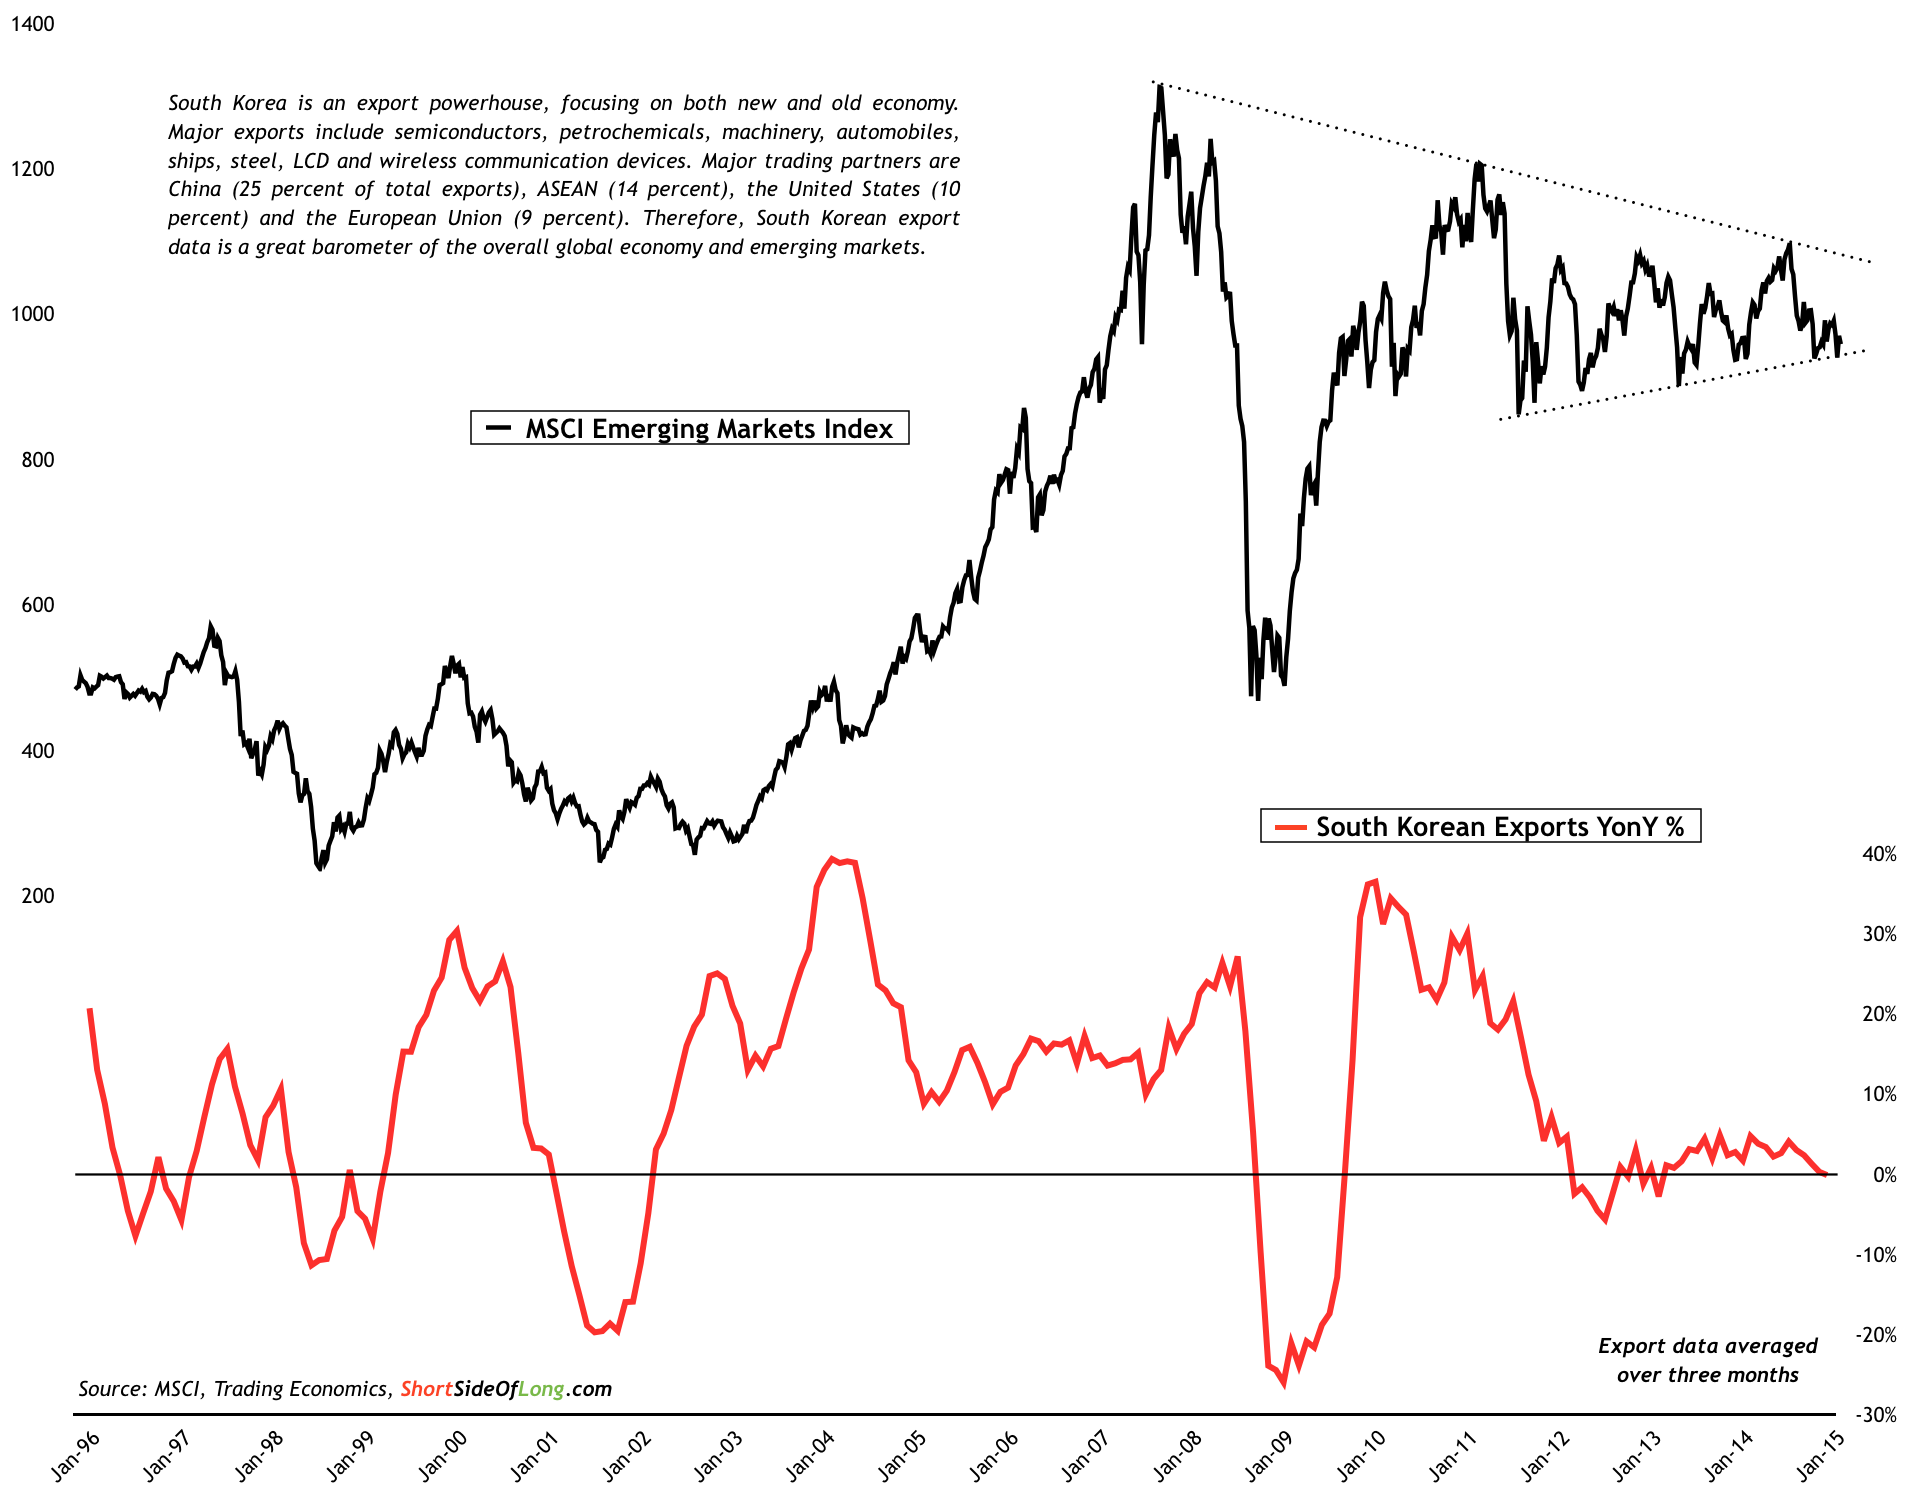
Personally, I find this very hard to believe (I actually find any data published by any government hard to believe anyway). First, Chinese economic leading data measured by steel, cement and electricity consumption is either flat or contracting year over year. In other words, there is barley any growth in these sectors. Second, railroad cargo freight is contracting at a much worse rate then during the 2008 Global Financial Crisis. Finally, one of China's most important trading partners is South Korea, which is also reporting flat export growth.
Chart 6: South Korean export growth paints much better picture of China
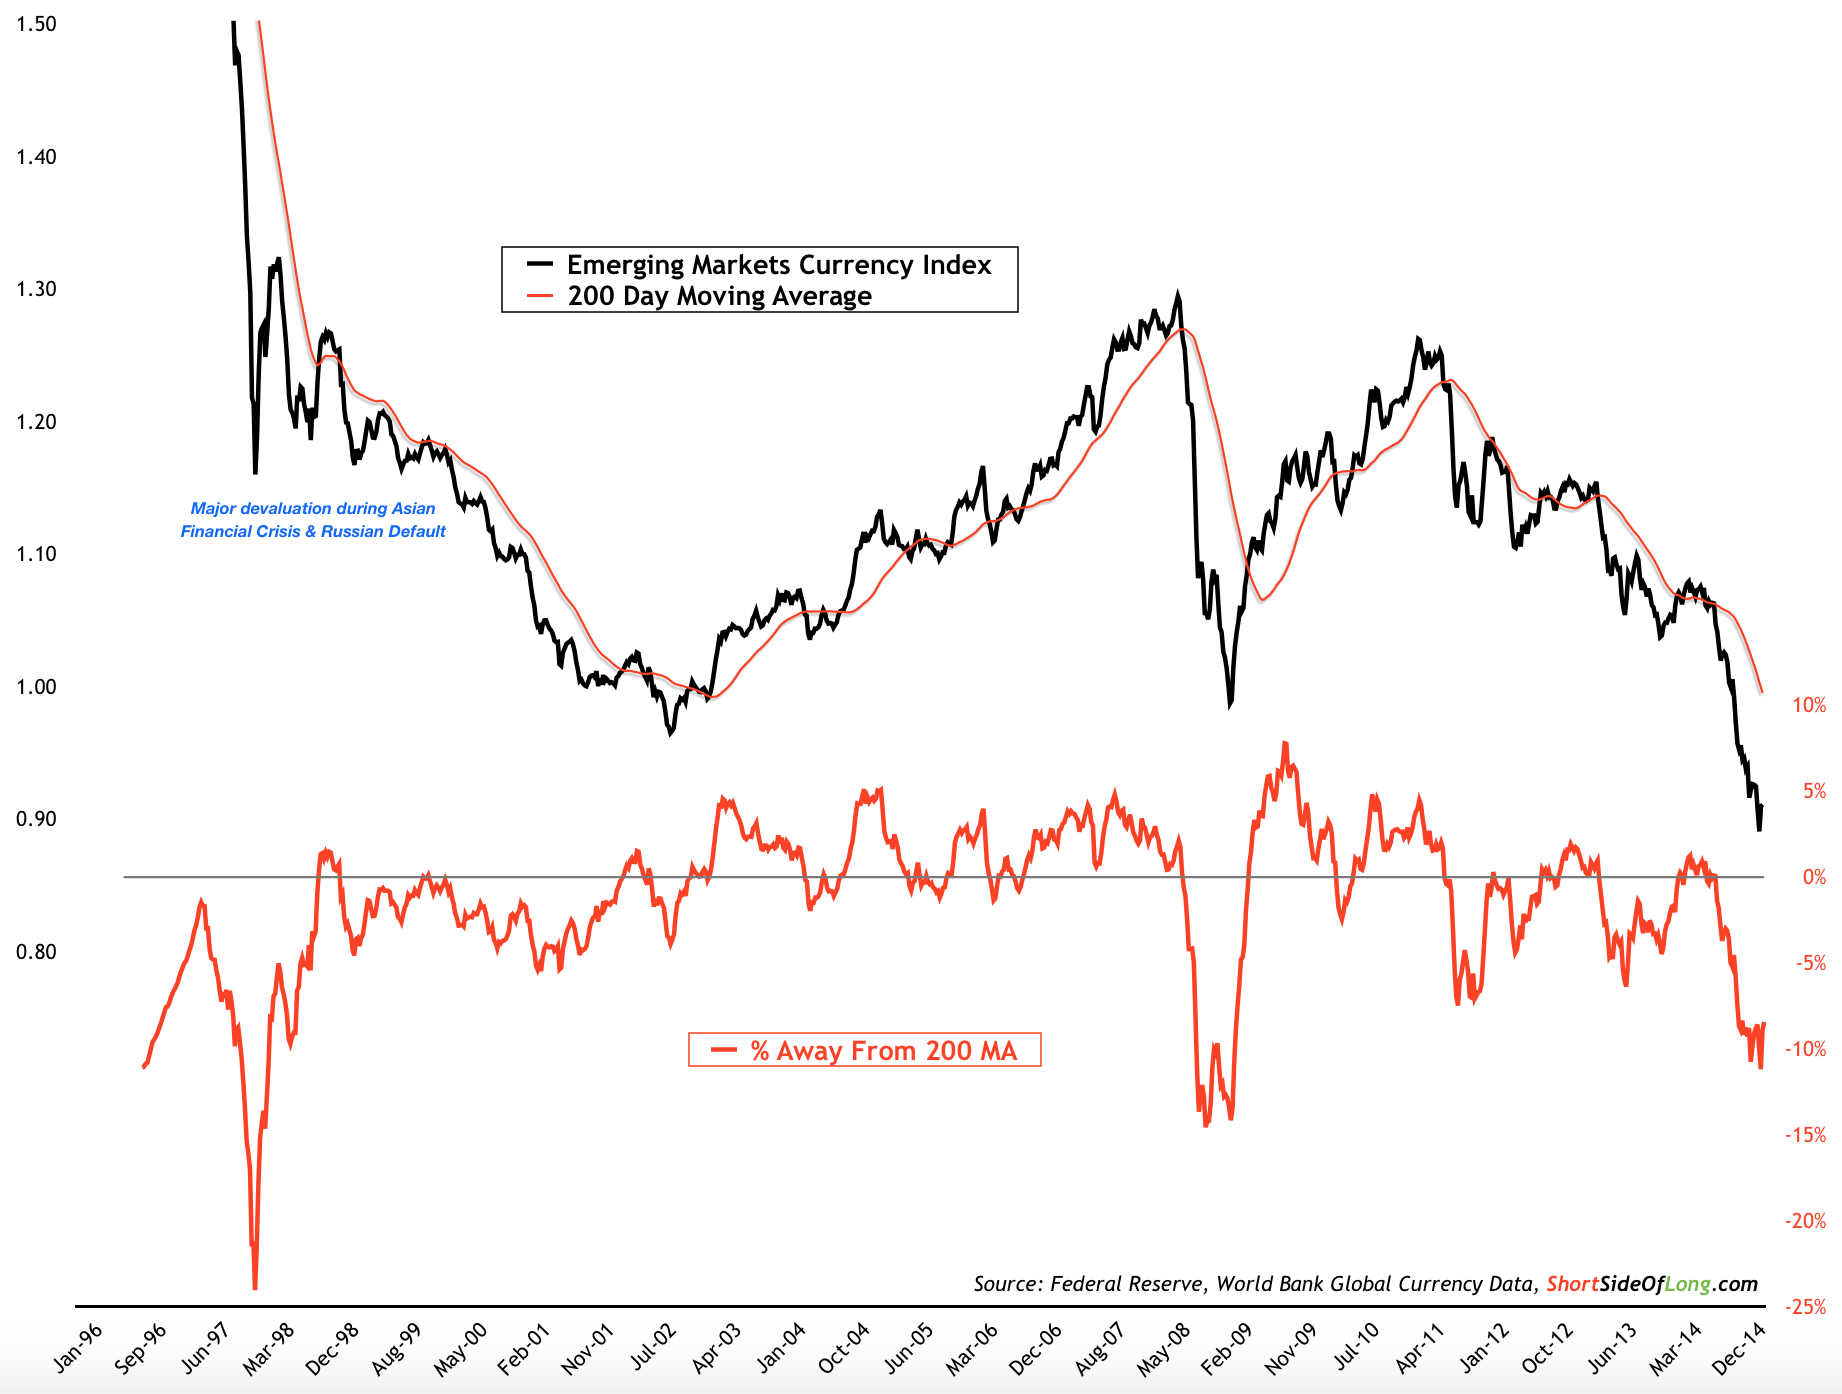
So if export growth around the world is flat or even contracting, one would assume that the stock market performance isn't going to be all that good. This would explain why emerging market stocks have been such a laggard for so long and remain in a technical triangle pattern of indecision. However, in recent quarters there has been a very strong devaluation of emerging market currencies, which could now start to increase the competitive pricing and therefore boost exports once again (refer to Chart 7), potentially leading to a rebound in earnings as well.
My personal, Emerging Market Currency Index is equal weighted in its composition and includes the Brazilian real, Russian ruble, Chinese yuan, Indian rupee, Indonesian rupiah, Malaysian ringgit, Mexican peso, Turkish lira, Thai baht, Polish zloty, south African rand, Singapore dollar, Taiwanese dollar and Korean won. Looking at the chart below, the Emerging Markets Currency Index has broken down to new lows and is at one of the most oversold conditions in the last two decades.
Chart 7: Falling currencies to increase competitive edge and boost exports
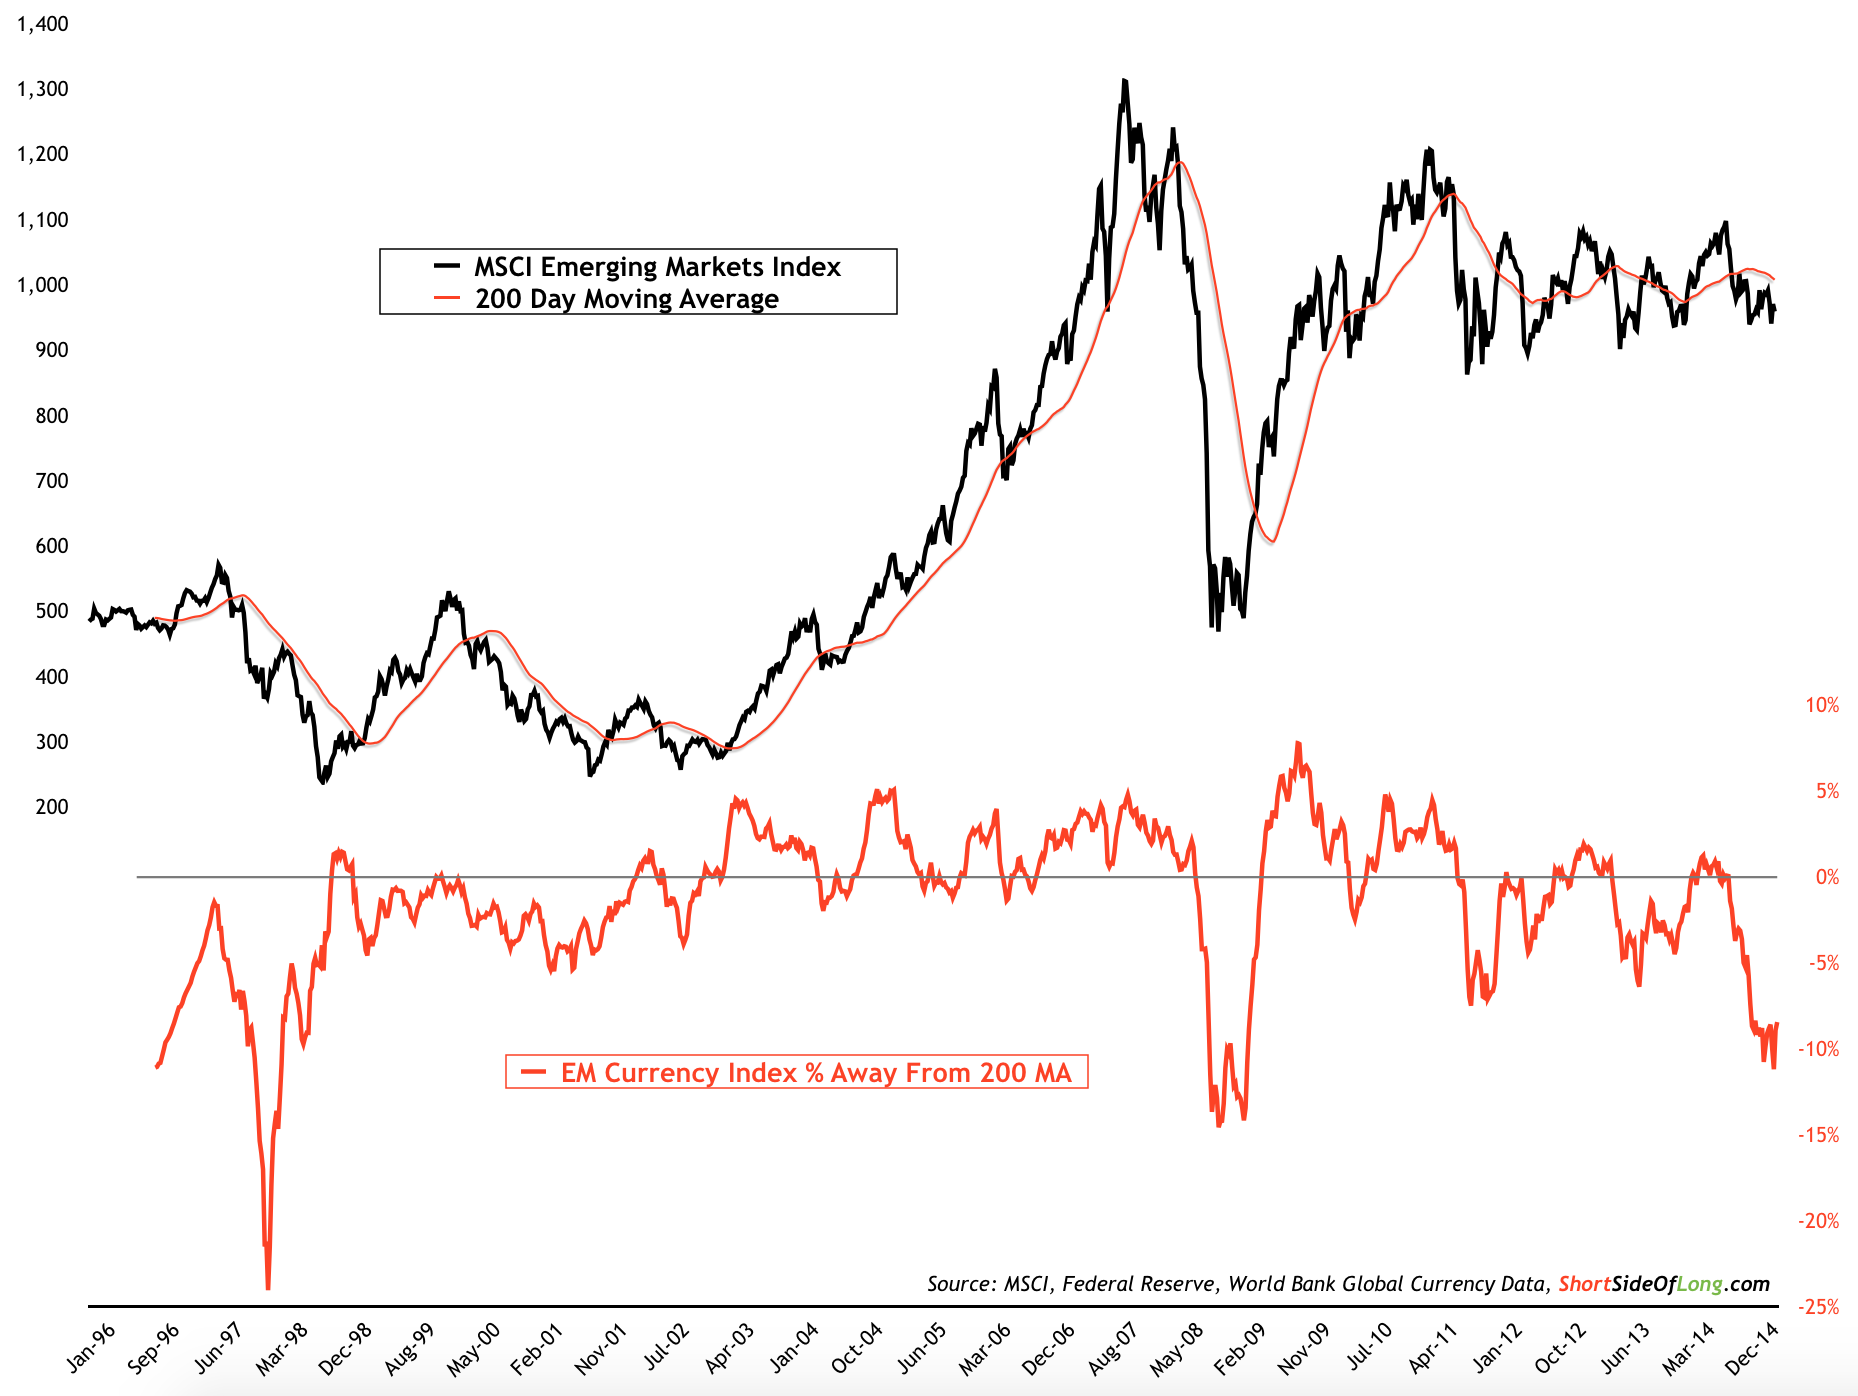
Chart 8: Historically, crash in EM currencies tends to bottom EM stocks
Now, bear with me for a second. While there are similarities between Chart 7 and 8, in Chart 8 the EM Currency Index was removed and replaced it with the MSCI Emerging Markets stock index while keeping the indicator in red. Basically, I did this to show readers that whenever Emerging Markets devalued currencies to such a large degree - in other words the US dollar rallied powerfully - the region gained some kind of competitive edge as export growth eventually picked up. And since markets are a discount mechanism, historically stocks tend to sniff this out very quickly and usually a buying opportunity is at hand.
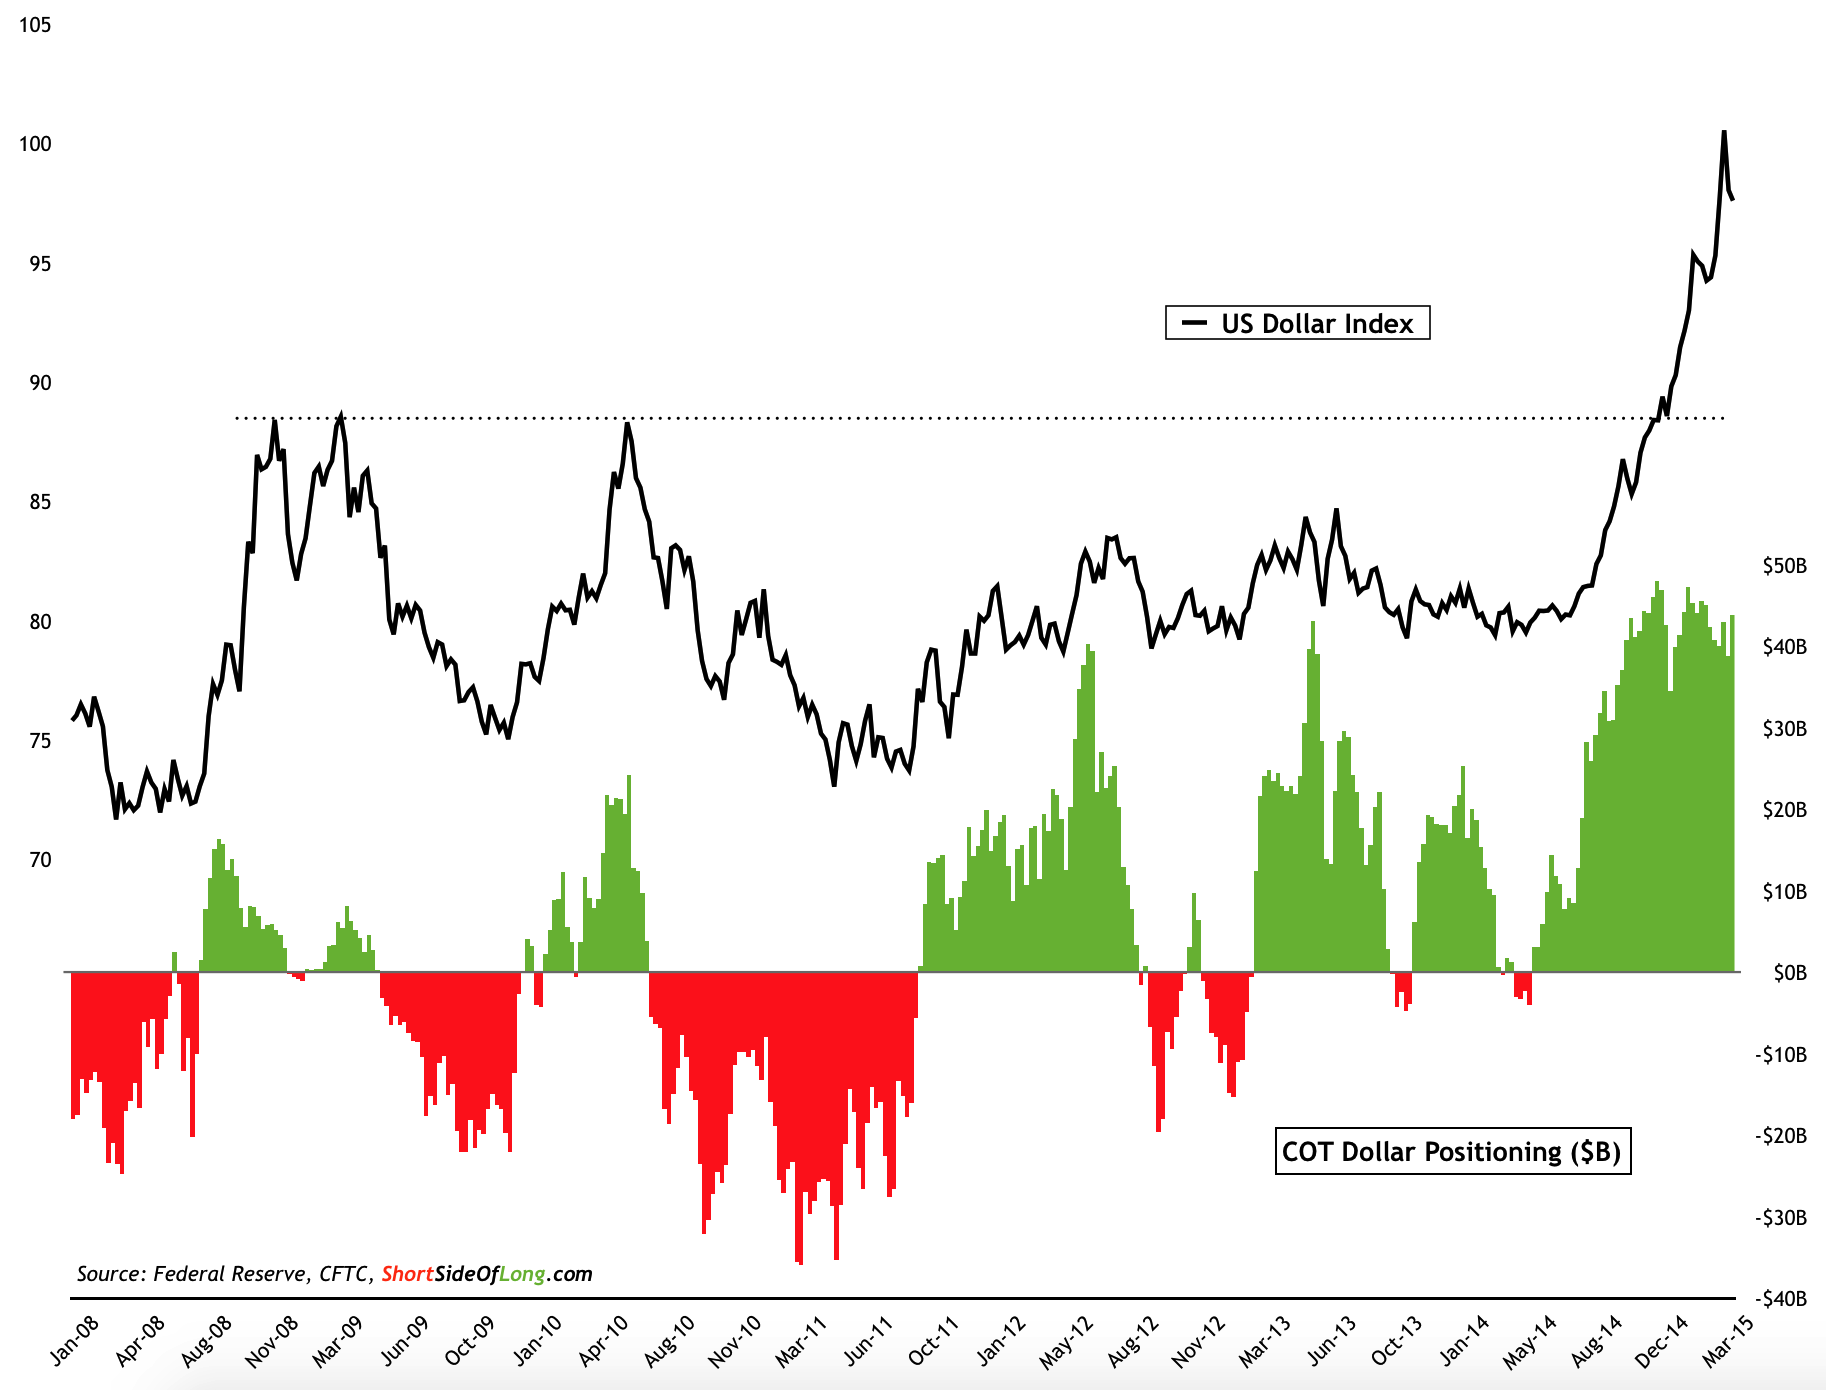
Chart 9: Dollar sentiment is extremely bullish and might correct for a while
I should further add that during the recent, powerful rally in the US dollar, the majority of international equity indices under-performed, so we should entertain the idea that a correction in the greenback could create a rebound in some of these oversold assets as well. As discussed in last week's post:
It seems that the major inflection point on the US Dollar Index occurred during last weeks FOMC meeting. Therefore, foreign currencies will now have a chance to regain at least some of the losses suffered in the last 9 months or so. This is true in particular for currencies where hedge funds and other speculators are holding very large short positions (refer to Chart 9). From a contrarian point of view, a short squeeze could now be playing out and rebounds might be swift and rather powerful, catching many of guard.
If the dollar is finally ready to correct for a while, then maybe some global fund managers might opt to relocate their capital towards unloved Emerging Market equities.
Chart 10: Simultaneously, fund managers have given up on EM stocks
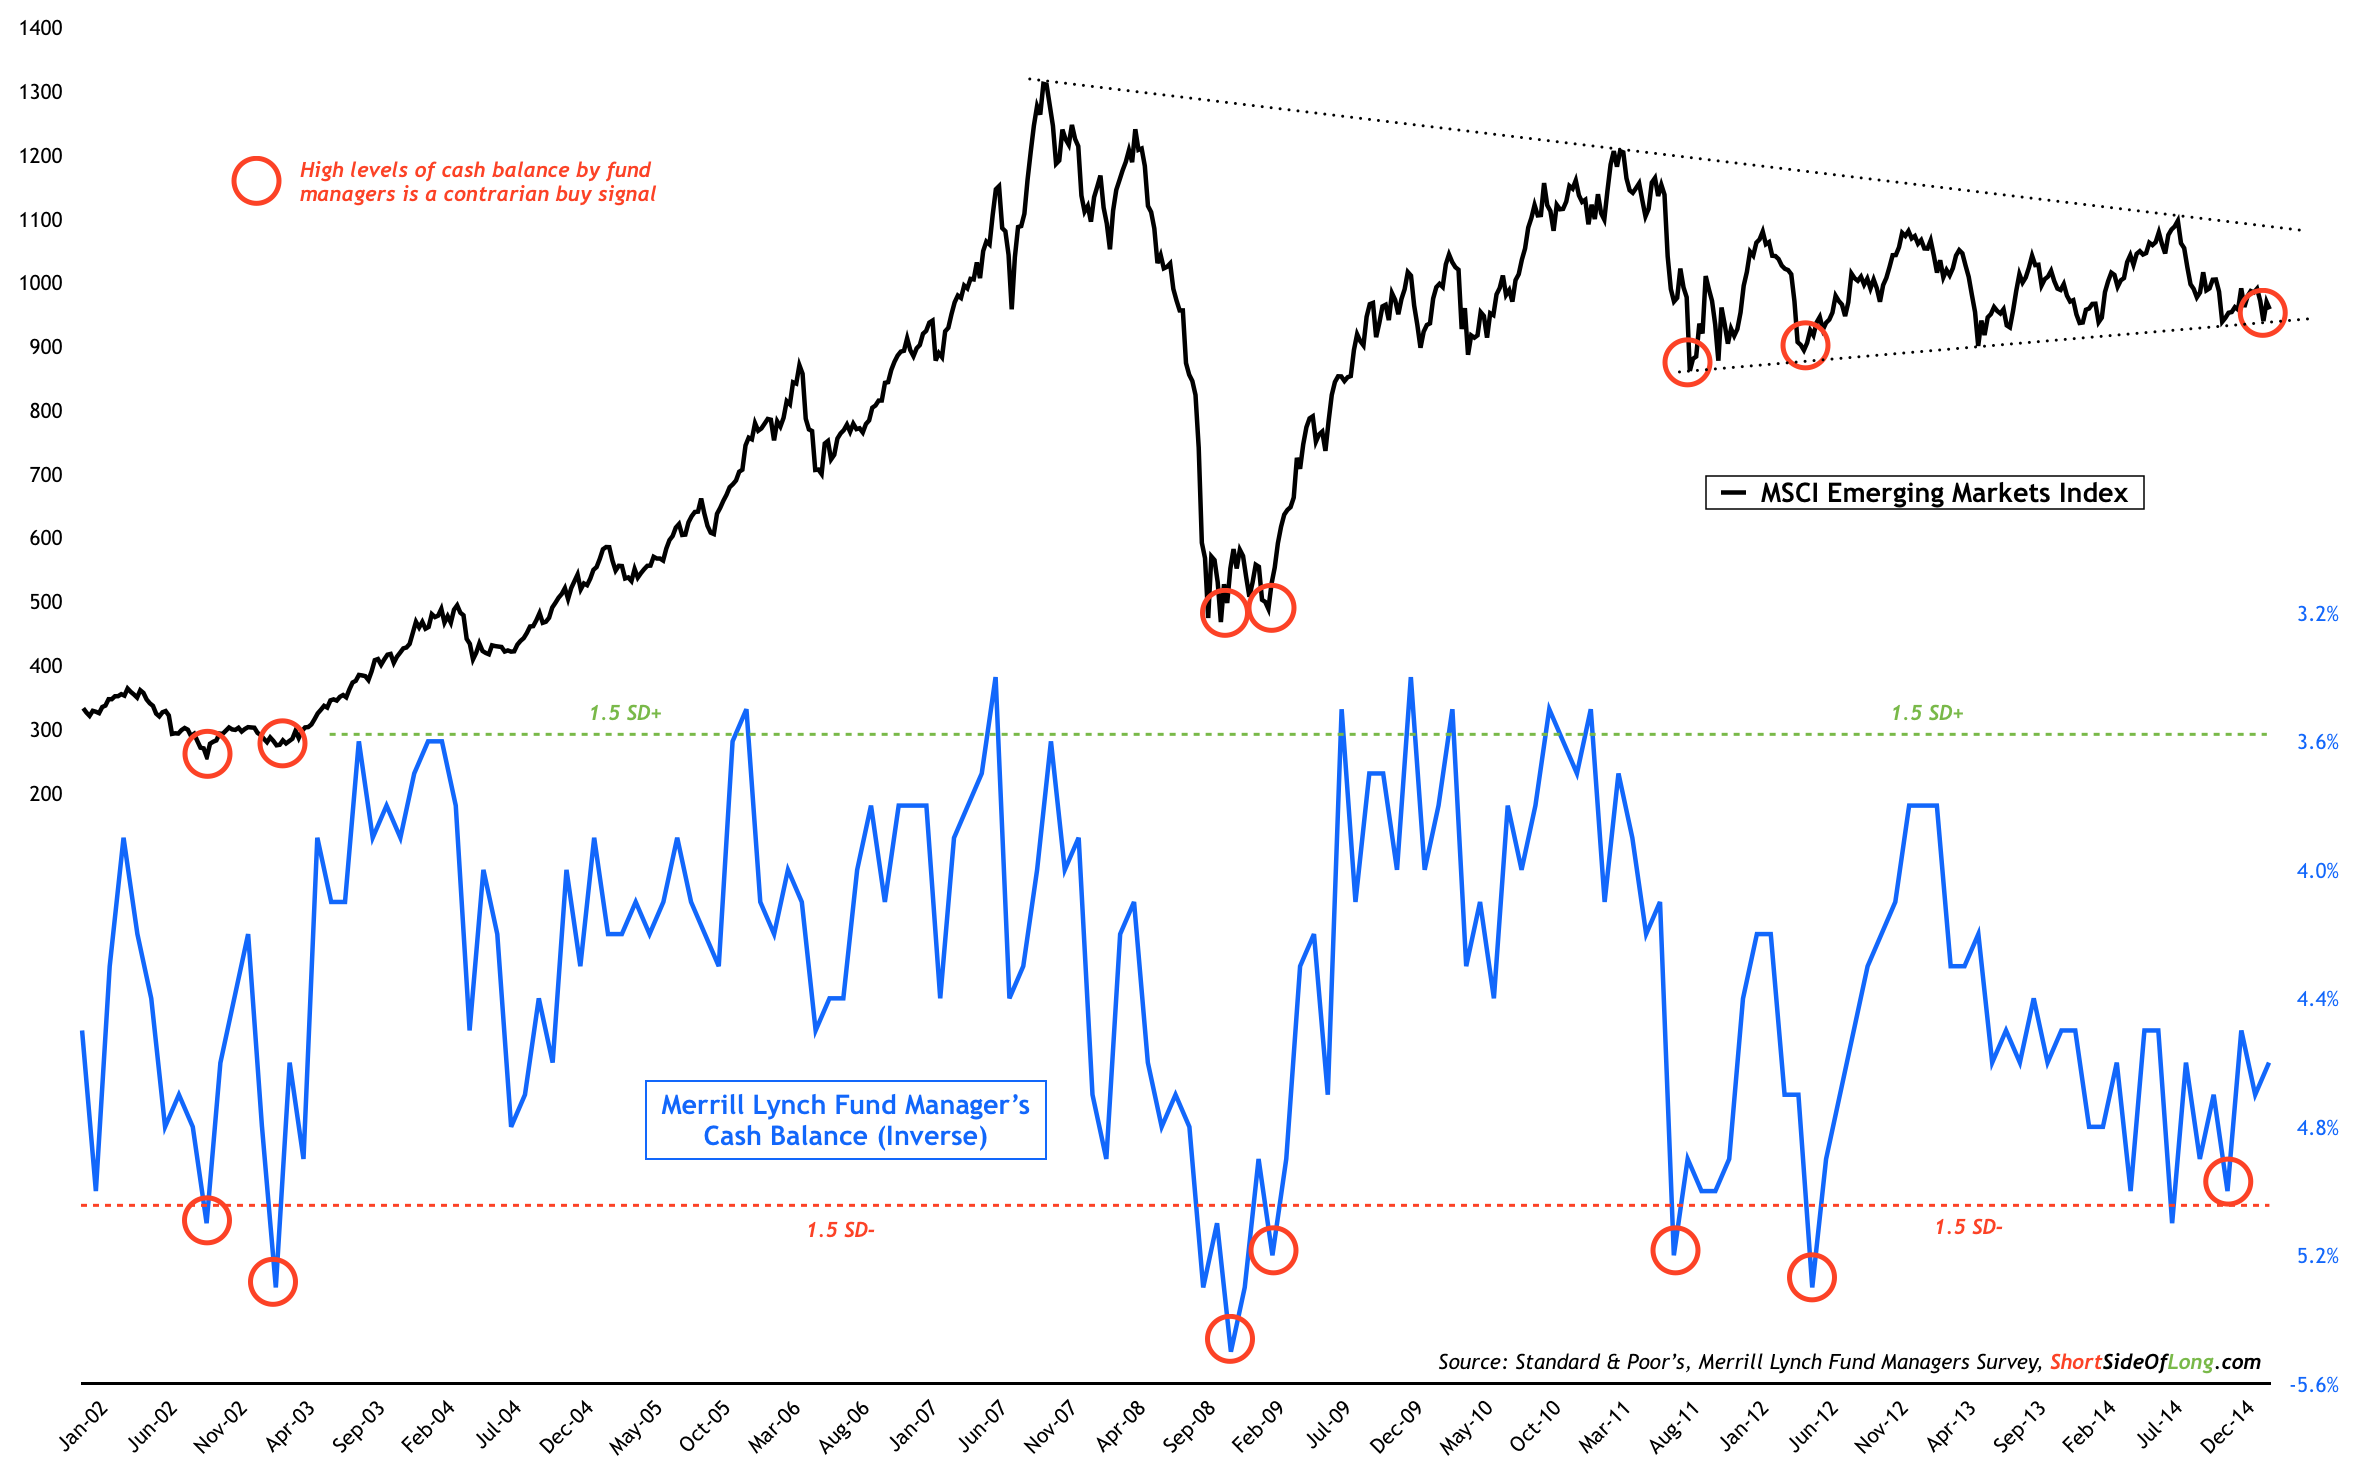
Chart 11: Data shows global managers hold relatively high cash levels
According to the recent Merrill Lynch monthly survey, which tracks exposure and opinions of over one hundred professionals with close to a trillion dollars in exposure, global money managers are by and large very much underweight Emerging Market equities (refer to Chart 10). At the same time, they have also built up quite a high cash buffer, currently sitting at 4.6% (refer to Chart 11).
Historically, the survey data has shown that both of these indicators at current levels, have produced very reliable buy signals. While there are no guarantees that this time will lead to yet another rally, the contrarian in me isn't surprised to see Chinese shares breaking out in recent months (keep in mind that China is the largest weighting in the EM complex).
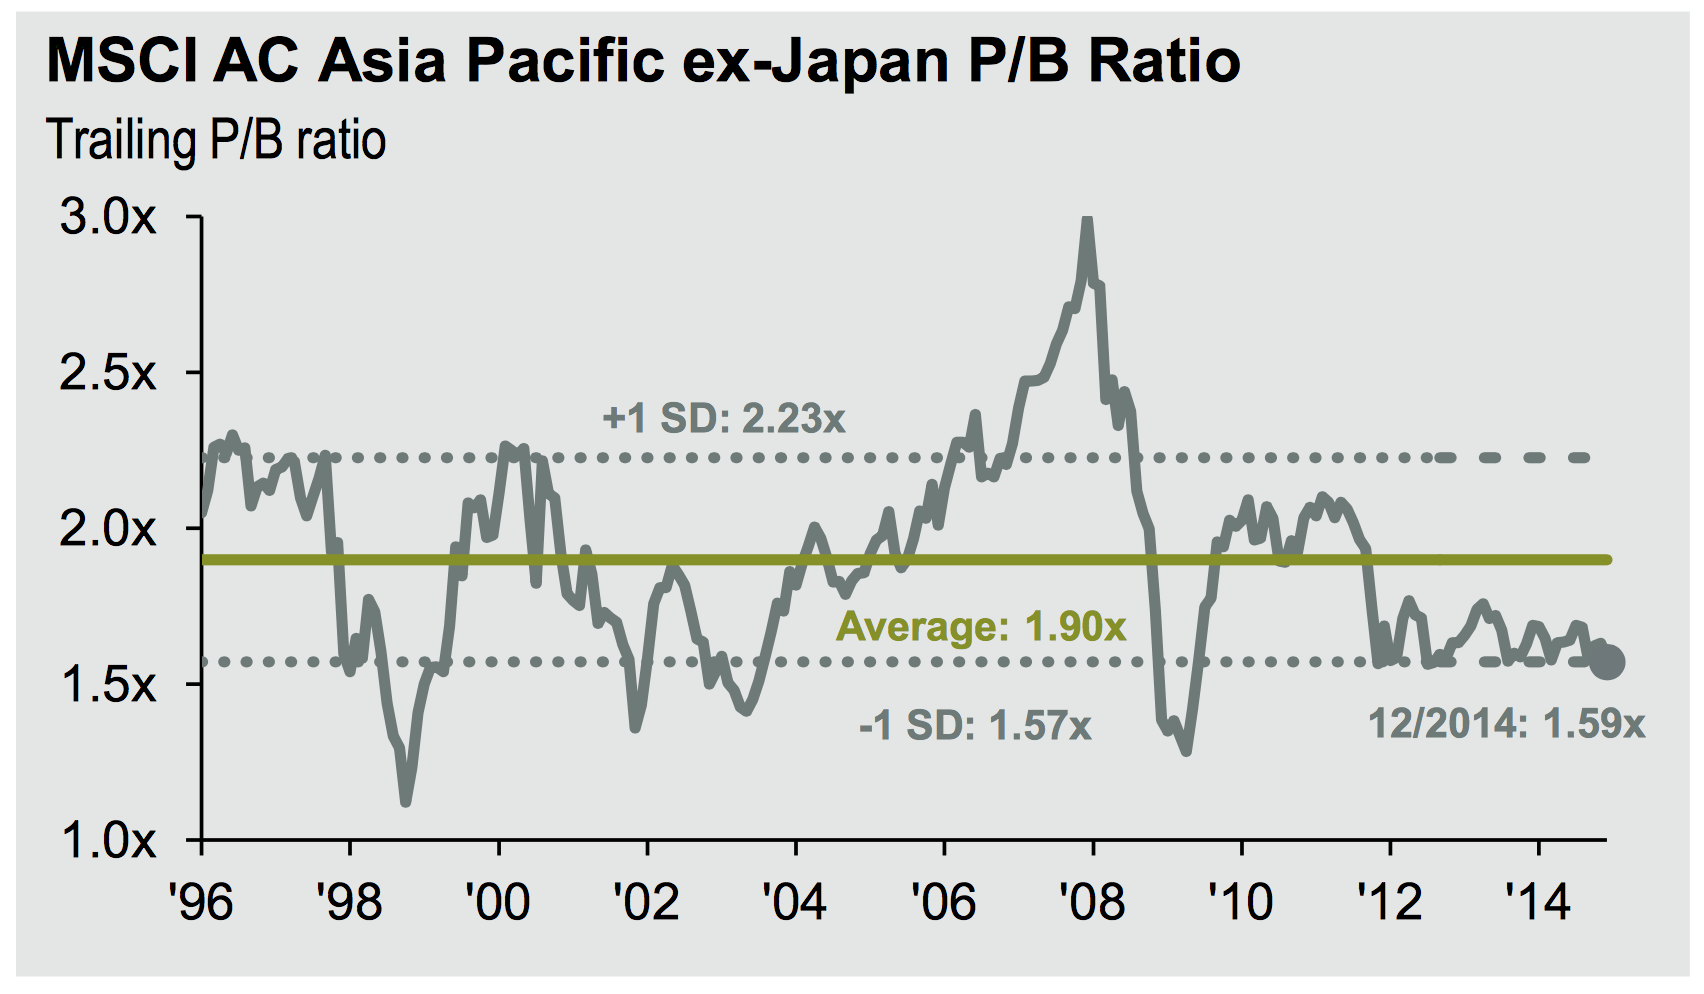
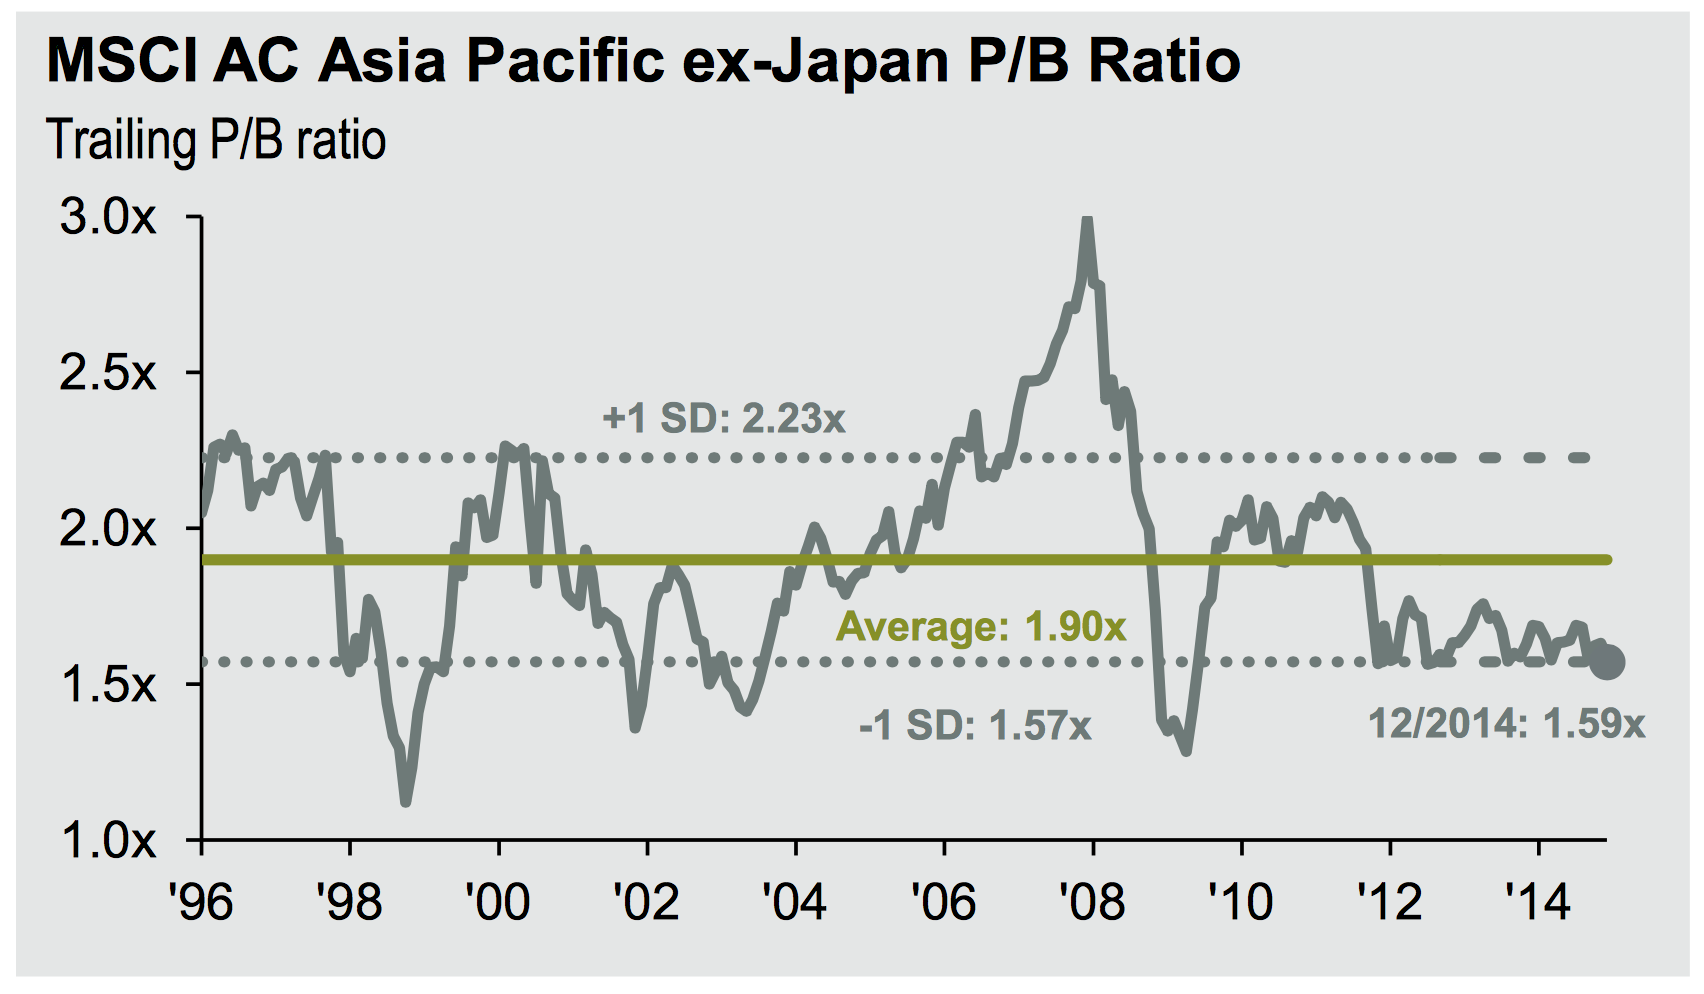
Chart 12 and 13: EM and Asian stocks valuations are attractive relative to US
Fund managers might also look at valuations and see that Emerging Markets, and in particular Asian equities, are quite cheap (refer to Chart 12 and 13). This is true in nominal and especially in relative terms. Price-to-book readings in the overall EM complex sit at 1.5 times, which is close to 1 standard deviation below its mean. Asian equities are even cheaper still. Surprisingly, the current valuation level have been sitting there for years, without inciting capital to bid up prices and without producing a sustained rally.
Therefore, I admit that valuations could become even cheaper, leading to grossly undervalued price-to-book levels we saw during 1998, 2001 and 2009 periods. In this scenario the US dollar would continue to rise (after a brief pause), pushing the Emerging economies into a sharp export contraction and an even more dramatic fall in earnings per share.
Basically, the case scenario I am painting here is one of a global recession and a repricing of EM stocks toward book value (or even lower). From the technical perspective, the price would break lower in the current triangle setup (refer to Charts 5, 6, 10 and 11).
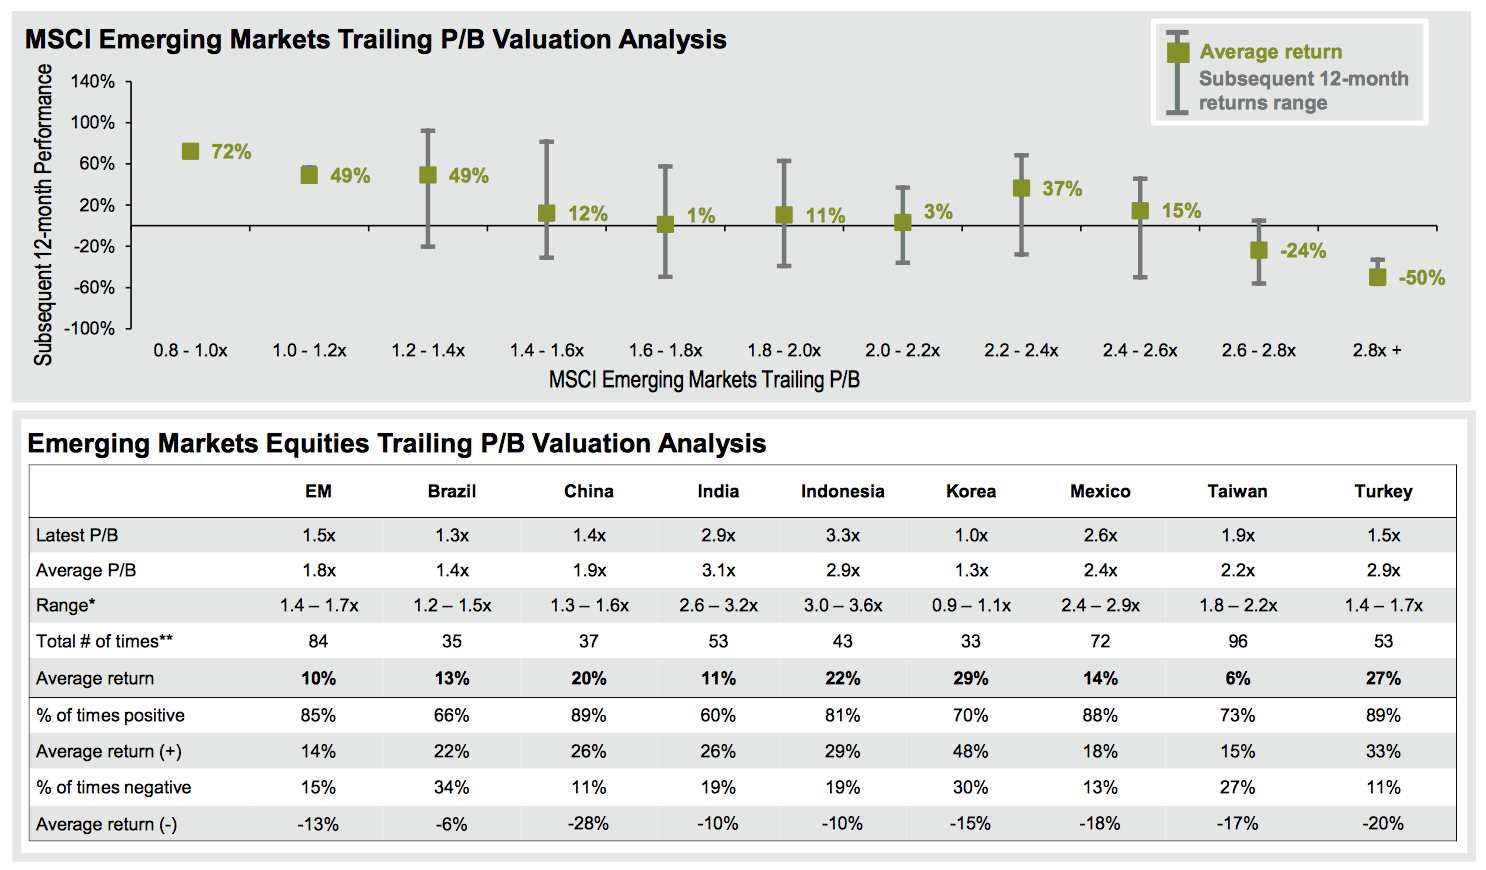
Chart 14: At current valuations, positive returns occur 85% of the time
Source: JP Morgan
These risks are real and should be monitored by paying close attention to the price. Having said that, JP Morgan concludes that at the current price-to-book value, the average annual return for Emerging Market equities is around 10%, being positive 85% of the time (observe Chart 14). These aren't bad odds to be quite honest, and personally, I have already started buying the index (I already own China from November of last year).
My risk control is quite basic for both investments, so in case EM stocks do break down and suffer a major meltdown as some bears are predicting, I am executing the trade with a very tight stop loss. My trigger is set below the triangle support pattern seen in many charts above. On the EEM ETF, the stop loss would be a price close below $38 per share (refer to Chart 1 again).

