It was a pretty uneventful day in the stock market at least by the looks of the S&P 500. The semis were the hot sector with both the SMH and SOXX both rising nearly 6% following Lam Research (NASDAQ:LRCX) and Xilinx (NASDAQ:XLNX) results, Applied Materials (NASDAQ:AMAT) and Teradyne (NASDAQ:TER) also benefitted as they should.
S&P 500 (SPY)
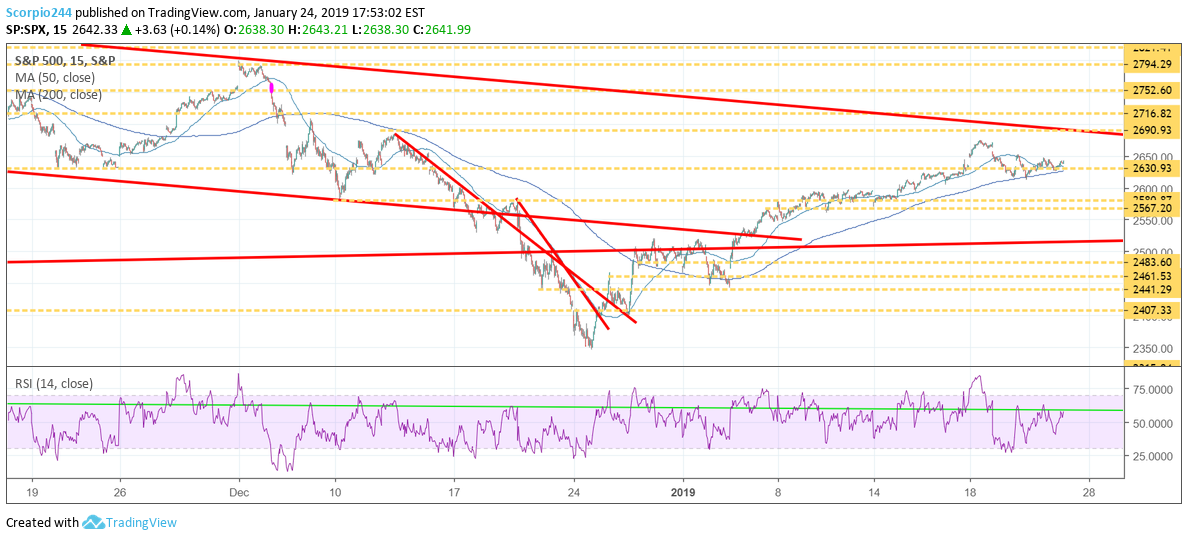
The S&P 500 continues to hold around 2,630, and I continue to see that as positive. The trend is still higher, and I'm beginning to believe we can rise back to 2,690.
Lam Research (LRCX)
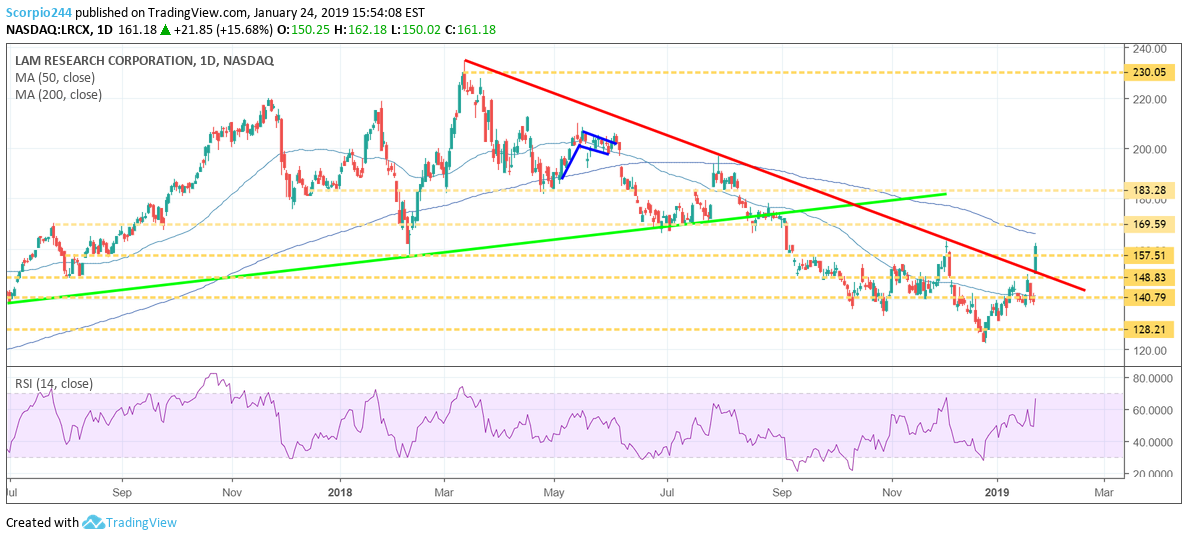
What may be the most important is that Lam Research has finally broken a long-term down which has been in place since March. It is hard to deny there was a break out in this case. The next area of resistance for Lam comes around $170.
Applied Materials (AMAT)
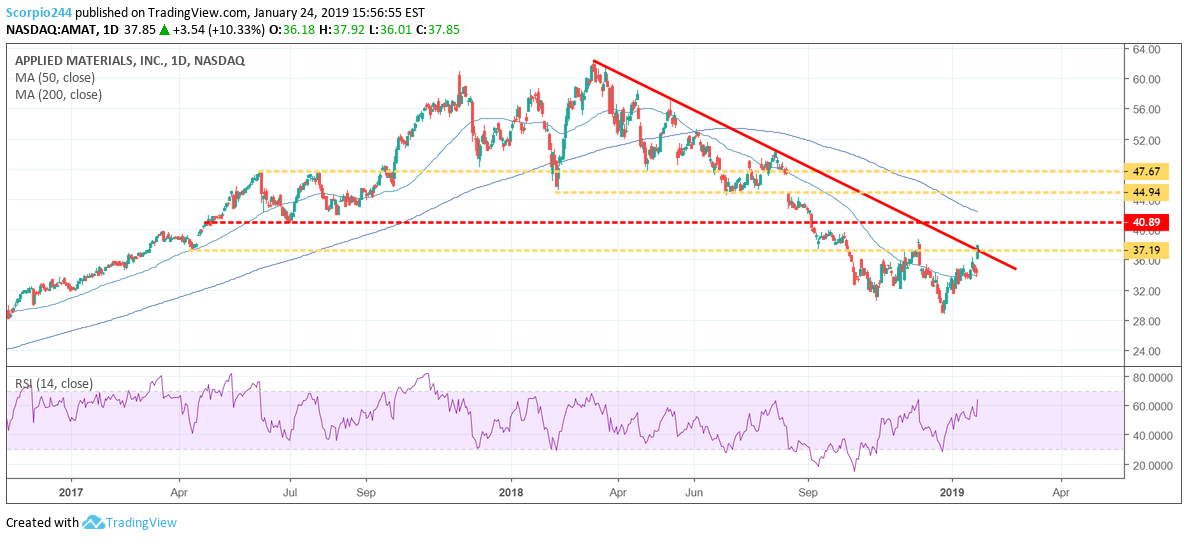
Applied Materials is also rising above a downtrend that has been in place since March. The stock is attempting to break out rising above $37. It could result in the stock soaring to around $41.
Micron (NASDAQ:MU)
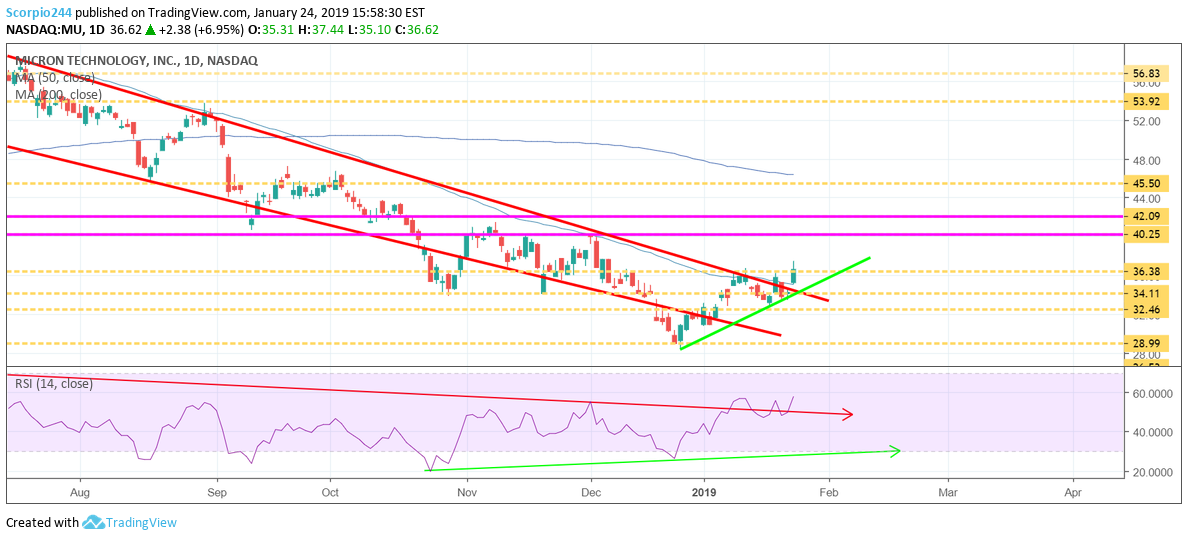
It is also becoming clear that Micron is now forming an uptrend, and the stock is again testing resistance around $36.50. The stock could continue higher towards $40, which is an area we have waited for some time.
Intel (NASDAQ:INTC)
Intel reported results and the guidance for the first quarter was pretty bad. With the company looking for $0.87 versus estimates of $1.01. Meanwhile, Intel is guiding revenue to $16 billion versus estimates of $17.40 billion, a significant miss. The stock is trading down to $46.50 in the after-hours. $46 is clearly support for the stock. But I worry that it won't hold tomorrow. Very disappointing.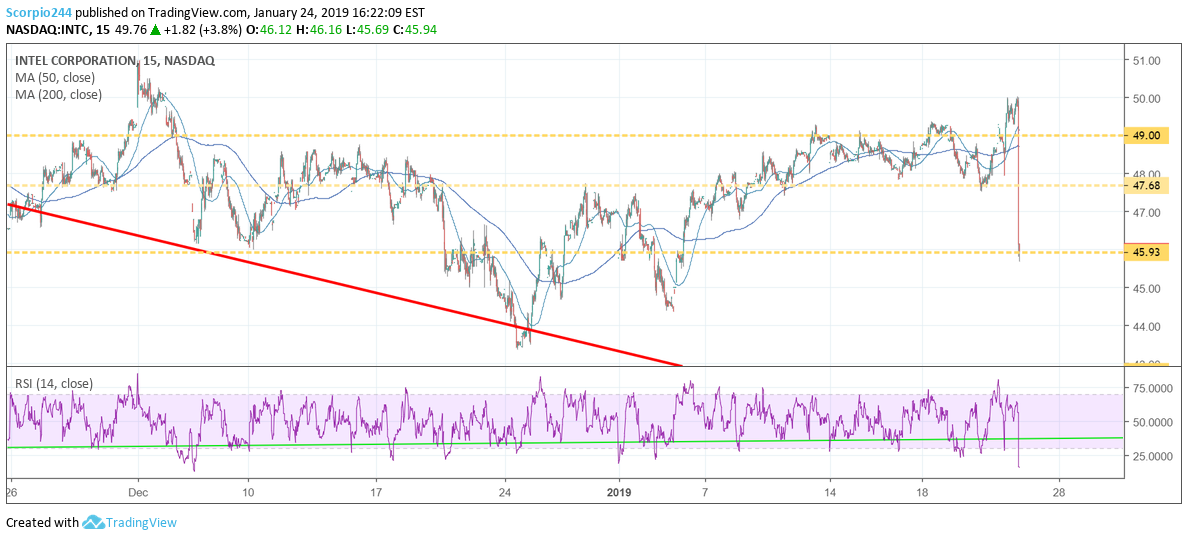
Roku (NASDAQ:ROKU)
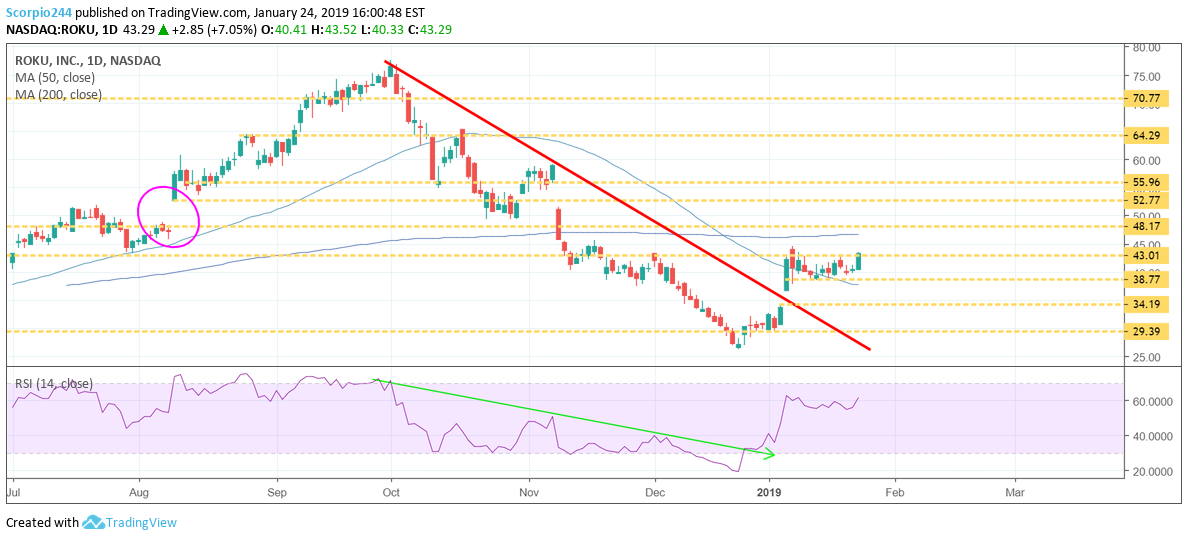
Moving on Roku is trying to break out around $43. Admittedly, I may be proven wrong with this stock, as I had expected the stock would fall back to $34. I guess we will find out soon enough. Should it successfully break out, then $48 is the next level to watch out for.
Square (NYSE:SQ)
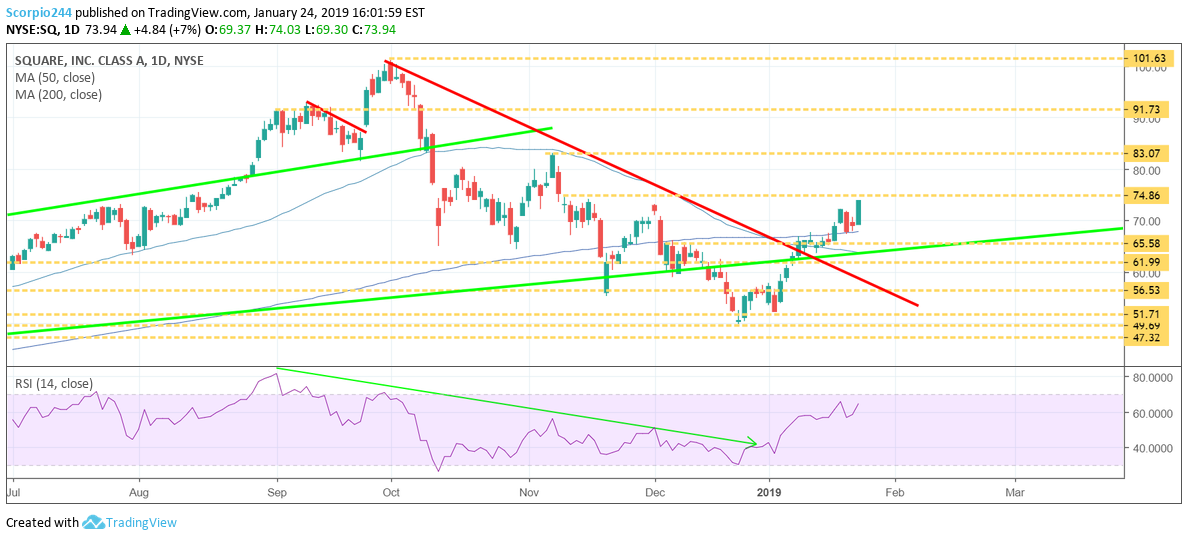
Square continues its rise and is quickly approaching resistance at roughly $75. Now the stock could rise towards $83.
Starbucks (NASDAQ:SBUX)
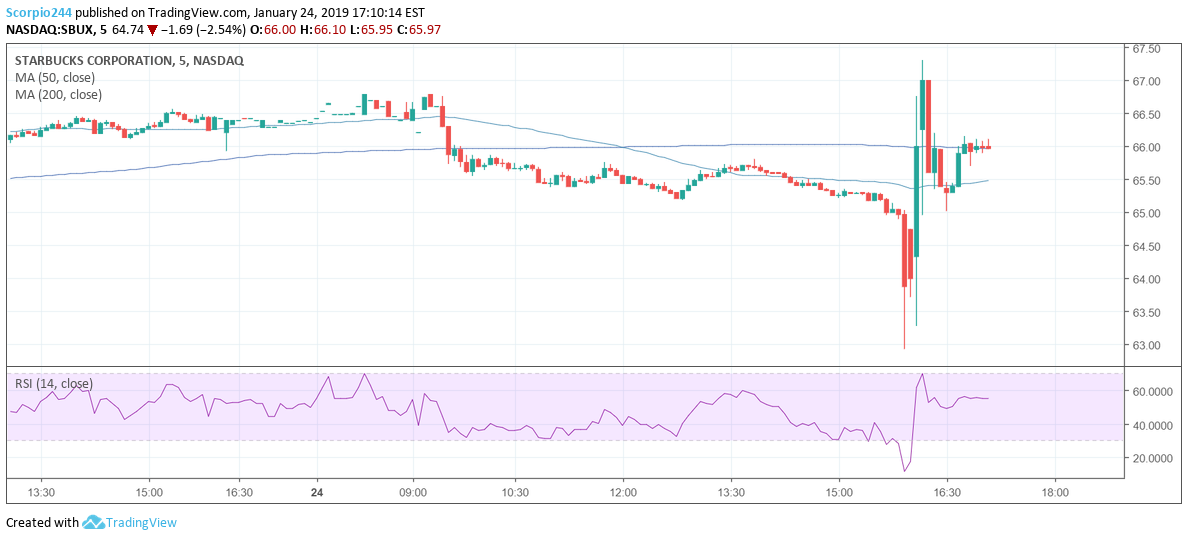
Starbucks reported better than expected results, that topped estimates by $0.10 per share, while revenue rose to $6.63 billion versus $6.49 billion. Guidance for 2019 is $2.68 to $2.73 versus estimates of $2.65. But, when you look at numbers beyond the results like China Comparable Store Sales Up 1% --really!? Meanwhile, the comps in America appear strong up 4%, but it is all from tickets, with the transaction at 0%. I guess if they can keep raising prices good for them. The stock is rising after the results.
Netflix (NASDAQ:NFLX)
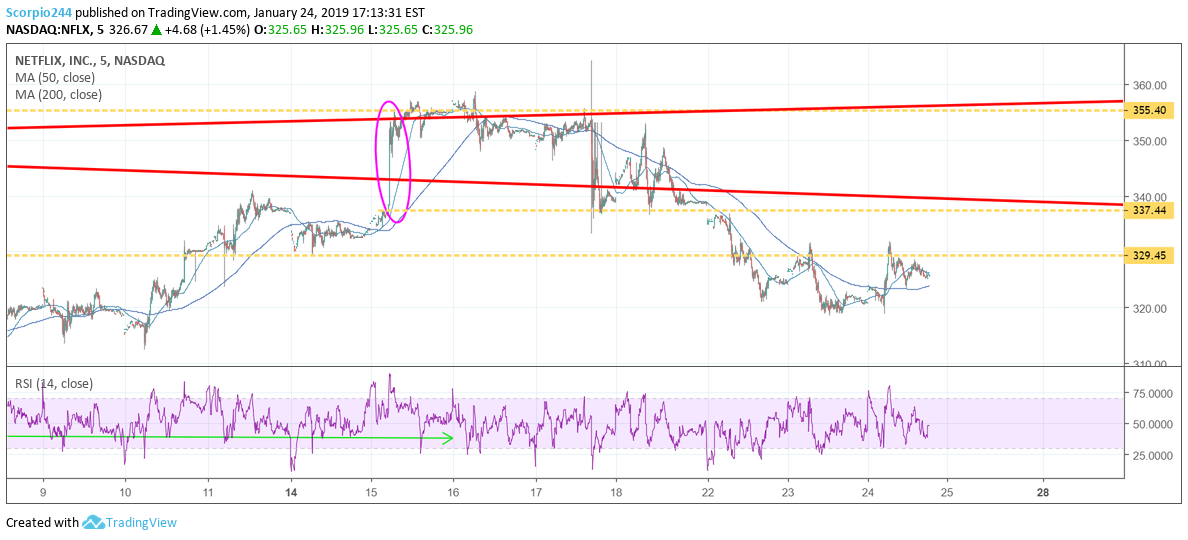
Netflix is trying to get some forward momentum, but it continues to fail at resistance around $330.
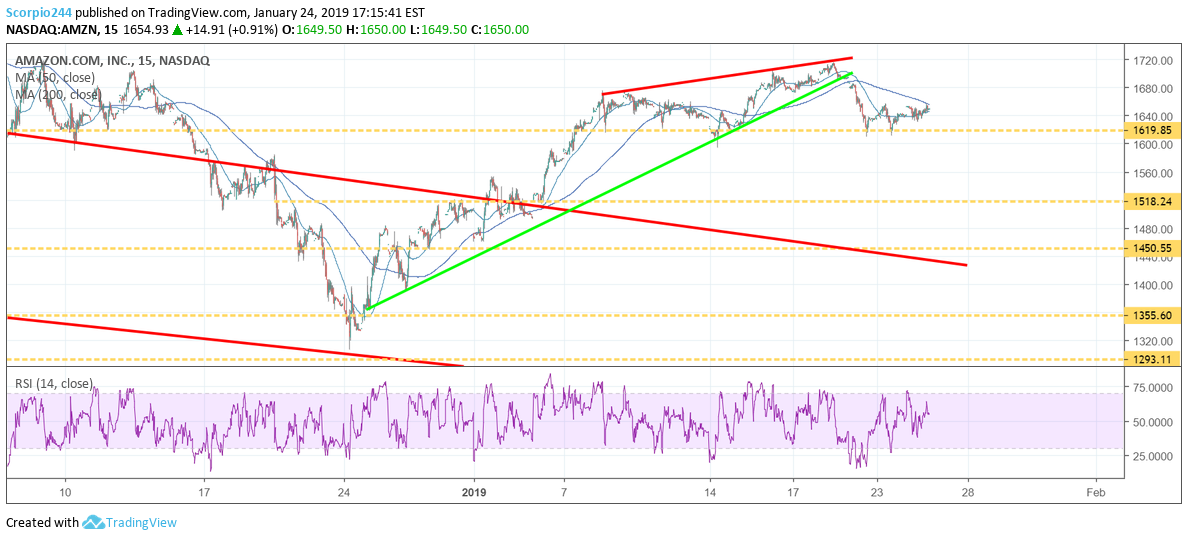
Amazon (NASDAQ:AMZN)
Amazon continues to hang around support at $1620.
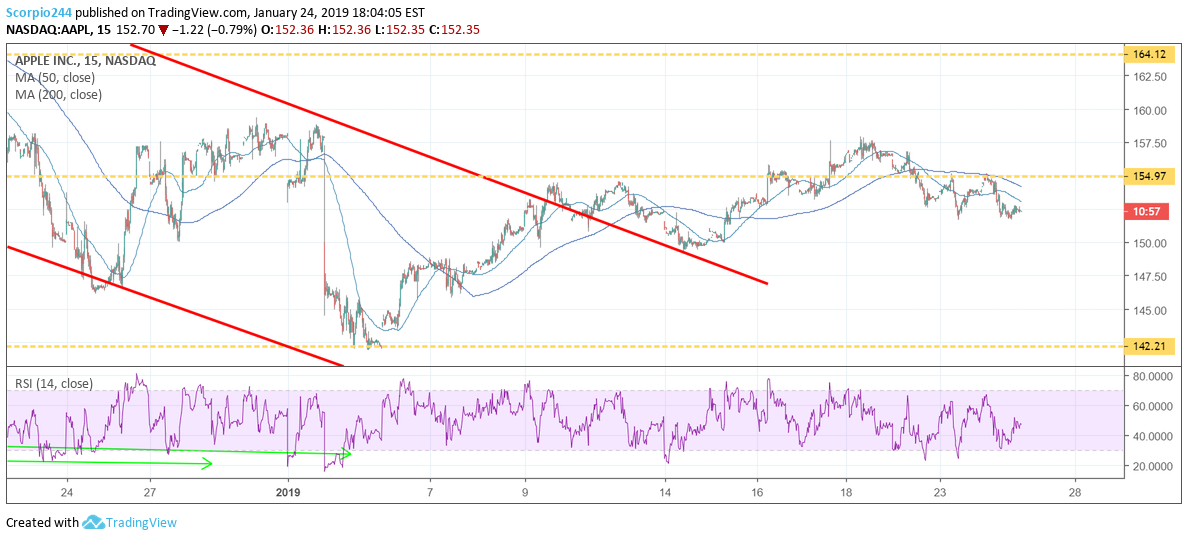
Apple (NASDAQ:AAPL)
Apple is still struggling at the $155 level and the break out from last week is surely not taking hold this week. We are going to have to wait for results now, it is going to come down to guidance and how much stuff Tim Cook could get into his shopping cart.
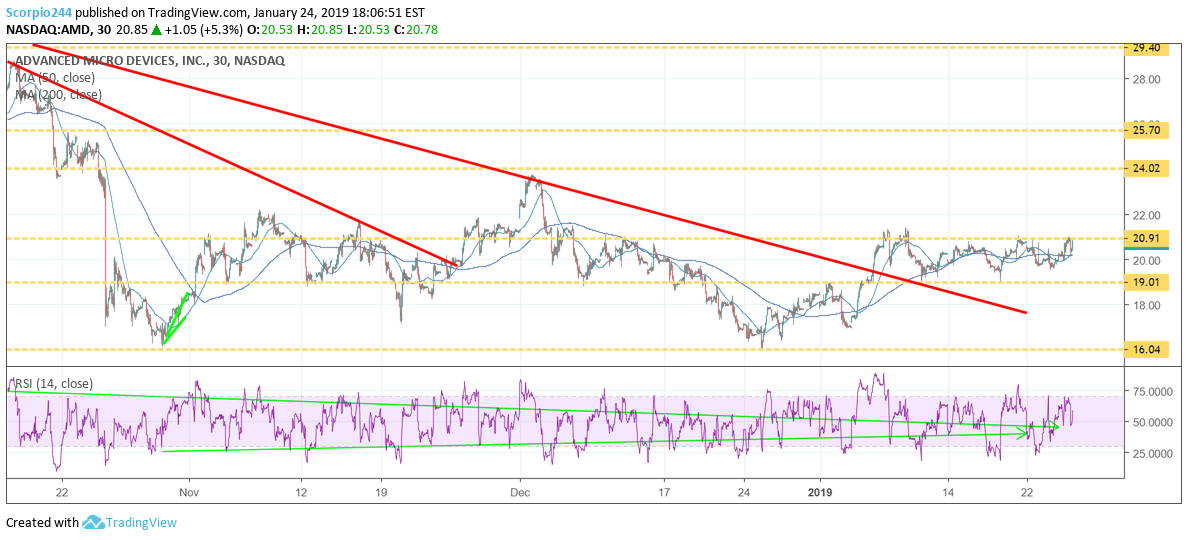
AMD
AMD is back to resistance around $21, which has been a problem area for the stock since November.
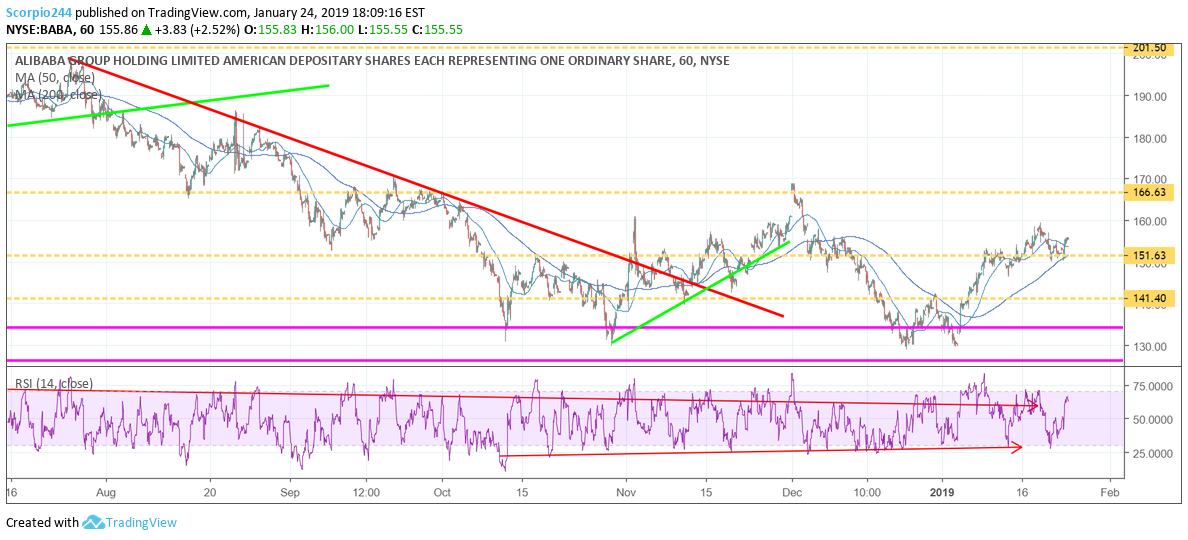
Alibaba (NYSE:BABA)
Alibaba continues to look fairly strong holding support around $151.60. $166 is in play.
Central Bank Wars
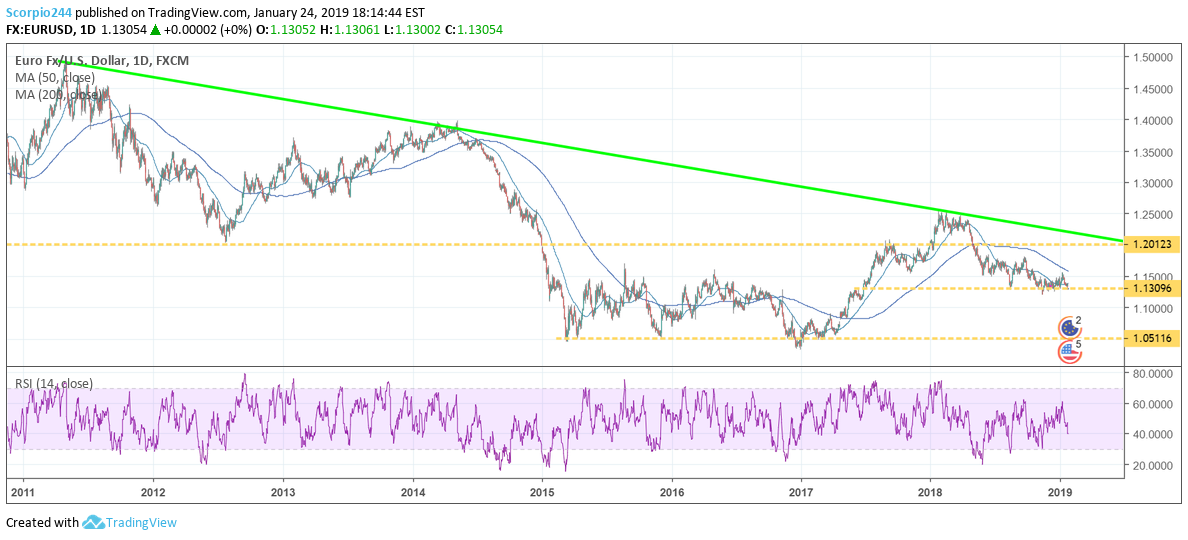
In Europe Draghi is talking about slowing growth and increasing risk for downward pressure on the economy. Of course, that means the euro is weakening versus the dollar. He always seems to be one step ahead of the Fed. The euro is now on the cusp of a major breakdown, which could send the euro sharply lower perhaps to 1.11 and then 1.05 to the dollar. A weaker euro is good for European exports and helps to stoke inflationary forces, but it will likely weigh heavily on commodity prices and inflation here in the U.S. If Draghi takes a more dovish approach towards monetary policy in Europe it all but makes it impossible for the Fed to continue raising rates, and that is very good for equity prices.

