Although almost every indicator I follow is still positive, I’m starting to see some chinks in the armor that suggest that a longer term top is in the making. Tops are a process and take a long time to form so there’s nothing to worry about yet, but here are some things to watch over the next several weeks.
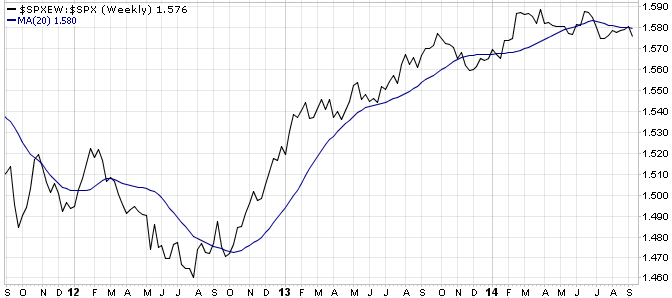
First is the ratio between the S&P 500 Index (SPX) and S&P 500 Equal Weighted Index (SPXEW). We use the 20 week moving average as a bullish/bearish line. When the ratio is below the 20 week MA, the market is often choppy as a result of reallocation rotation or the ratio falls as investors are rotating to safety. Recently it fell below the 20WMA, then retraced back to it and has turned down again. Investors are continuing to rotate to larger cap stocks which often precedes longer term tops.

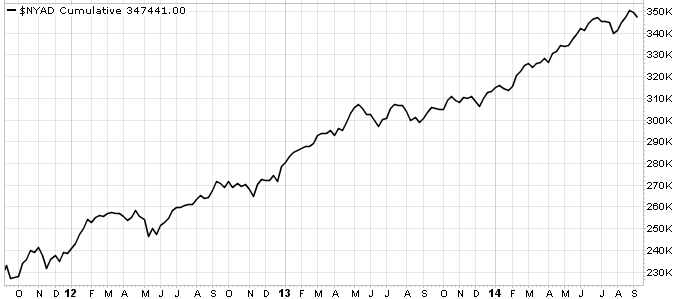
Next, the NYSE Advance Decline Line (NYAD) is reacting much more quickly to small price declines. This tells us that fewer stocks are participating as the market moves higher and a larger number of stocks are falling on days the market declines. This is an indication that the market is getting thin and market participants are getting selective.

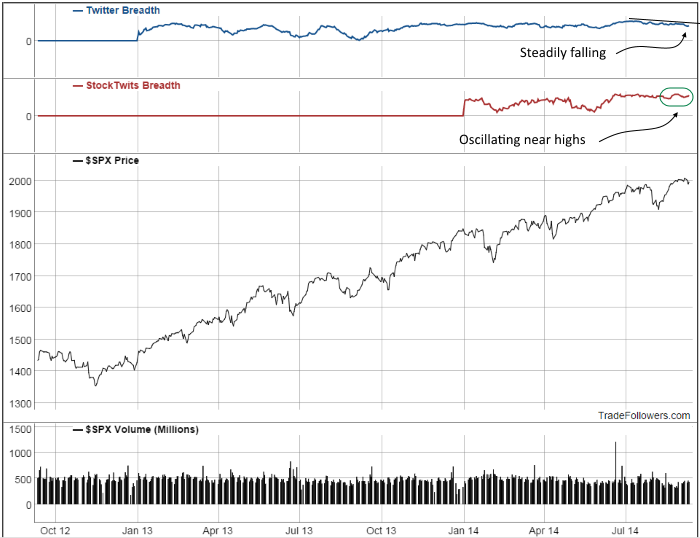
The Twitter Breadth indicator from Trade Followers is also showing some weakness. It has been steadily declining since mid June. Fewer stocks are showing positive momentum on Twitter and more are showing weakness. Meanwhile, the StockTwits breadth indicator from Trade Followers is oscillating near highs. The StockTwits indicator is comprised of mostly large and well known companies so when it holds up and the Twitter indicator falls it is a sign of rotation to large caps.

I’ve mentioned for the last few years that I don’t believe the market can decline substantially unless breadth deteriorates. We’re not at a warning point yet, but breadth isn’t reacting in a healthy way so near all time highs. As a result, it’s something to put on your radar to watch carefully.