If it seemed a bit calmer yesterday in global markets than has become typical, it was likely due to the absence of Chinese influence. China’s markets were closed for the country’s annual Dragon Boat festival, a holiday tradition that supposedly dates back 2,000 years. According to state media, it’s not strictly Chinese any longer.
The celebrations have apparently spread all across the globe, with a reported 85 countries and regions (if you have to include regions then it’s a stretch) participating. The good tidings infected such unlikely faraway locations as Uganda.
Markets reopened today in China spreading something else entirely. Chinese stocks, at least those represented by the Shanghai SSE, were down sharply. The index broke below 3,000 for the first time since September 2016. More importantly, the steady upward trend increasingly appears to have been broken in January. Those spreading global liquidations disturbed what had been consistent advance going all the way back to February 2016.
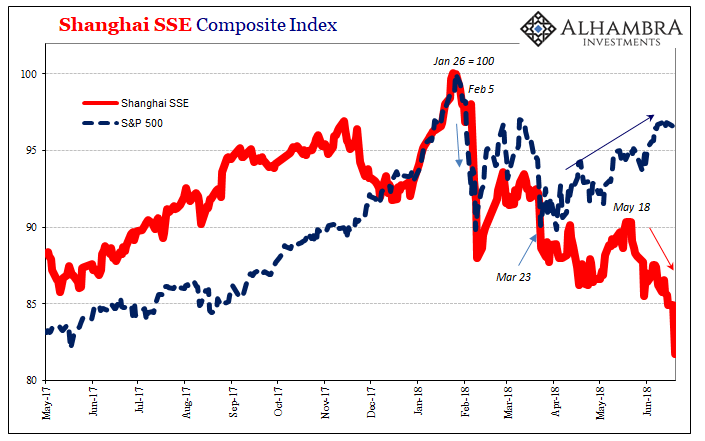
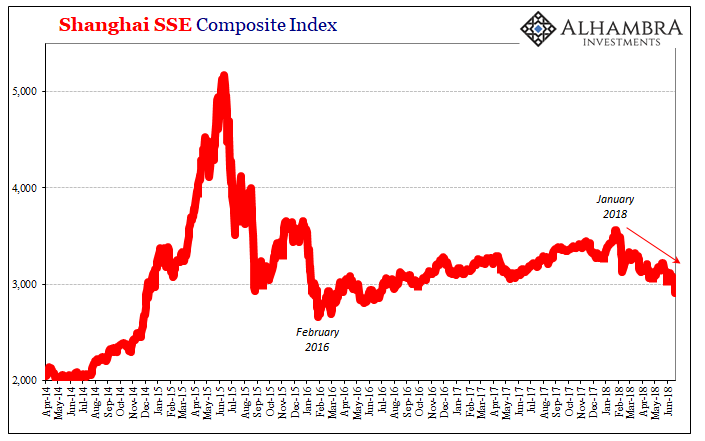
There are several issues with Chinese stocks recently, but none of them would explain why January 26. Authorities have promised to crackdown on leverage including the pledging of shares as collateral for loans and other debt. But they’ve been doing that for well over a year, and again what does that have to do with specifically late January?
That supposedly leaves us contemplating nothing but trade wars. For a time, global share prices were obviously correlated and linked. No longer. You might infer from diverging performances that investors are betting China will lose against the US as tariff exchanges heat up. Possibly, but there is so much more to consider.
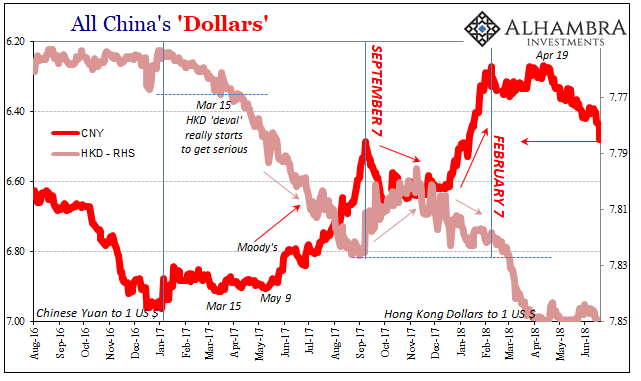
April 19, of course, is a date which features prominently for all the wrong reasons. For the Chinese, CNY hasn’t been spared the wrath of greater EM troubles. China’s currency reopened today down sharply from last week, which was already a multi-month low. It’s now within reach of 6.50, a pretty sharp decline from mid-April.
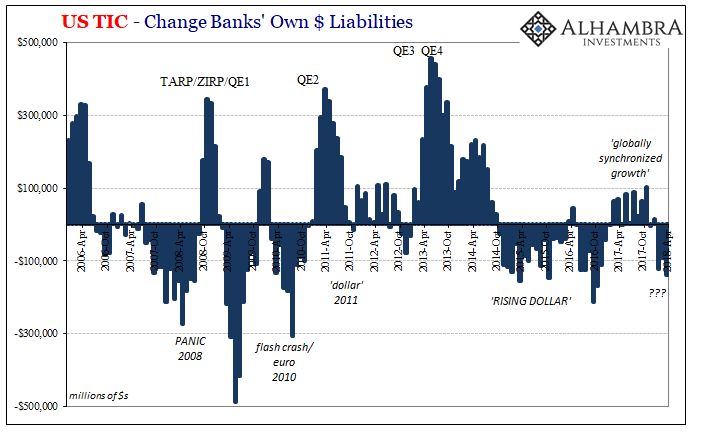
It’s important to add here that according to TIC in that same month of April Hong Kong banks suddenly cut back on their dollar business with US-based depositories. In March, while HKD careened toward the edge of HKMA’s approval, TIC recorded a massive rise in dollar trading.
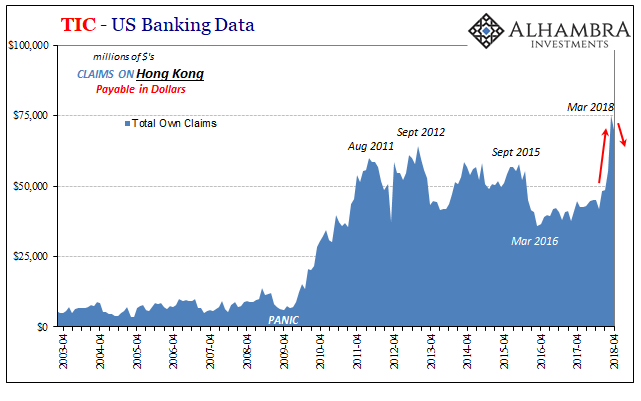
One of the usual theories of the more benign variety suggests one part of HKD’s struggles relates to the reverse of safety flows given how the global economy is now recovering as central banks around the world normalize policies. Globally synchronized growth is apparently bad for Hong Kong, too.
Yet, the TIC data proposes the opposite (no surprise there). What happened in February and March 2018 is in the same direction as 2009 to 2011; meaning that if the rise in dollar activity in the earlier period was somehow “safety” flows then the unwinding of those should have come out in the opposite way.
Instead, what we see here is that Hong Kong is borrowing more dollars on global markets. That’s actually what happened in the immediate aftermath of the 2008 panic, not that adherents to a closed economic system approach would have any idea why (or how).
Therefore, as HK banks began doing so around March and April 2017 that’s when CNY began to rise from the ashes and HKD fell into its inverse.
Now, in April 2018, has HK reached something of a limit or barrier? HKD would suggest as much, as does now TIC. The consequence of that appears to be 6.50, or worse (remember: CNY DOWN = BAD).
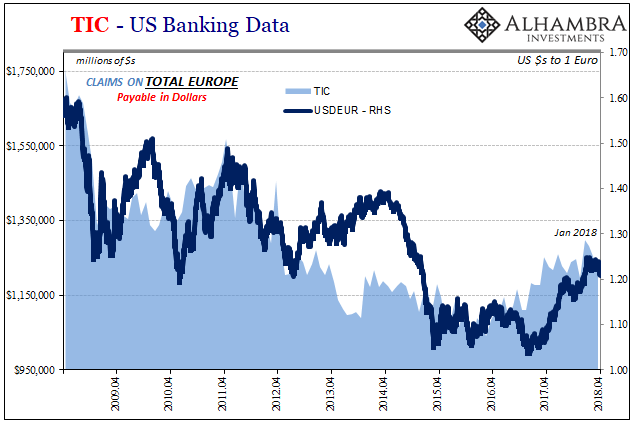
That’s not all the TIC figures relate. We have supposed that on the other end of Hong Kong supplying some good proportion of those “dollars” is Europe’s banks. In 2017 for the first time since 2011, banks in that jurisdiction increased their presence on the other side counterparty to US banks – which proposes that European banks have been more active in offshore “dollar” markets overall. That may or may not include HK in their renewed propensity toward money dealing, though it is a reasonable inference nonetheless (there simply aren’t any figures for dollars moving between European banks and those in Hong Kong which bypass the US, and US data, entirely).
According to TIC, there was one final push in that upward direction (consistent with both reflation and in this case the “weak dollar” coming out as both rising CNY and the “strong” euro) in January. Since, Europe’s banks have pulled back in each of the three months following. It’s not a massive correction by any means, but in non-linear terms it would seem to account for the euro’s changed course.
That’s especially true in the face of Japan’s continued withdrawal. The Fed wants to blame T-bills and India’s chief central banker wants to blame QT, but both should cast their eyes in the direction of Tokyo for a much more relevant and consistent explanation.
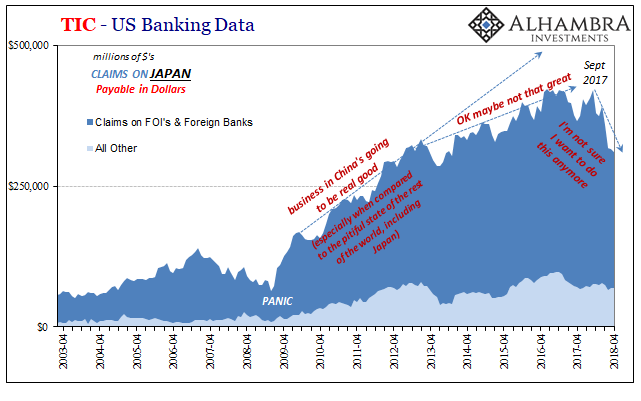
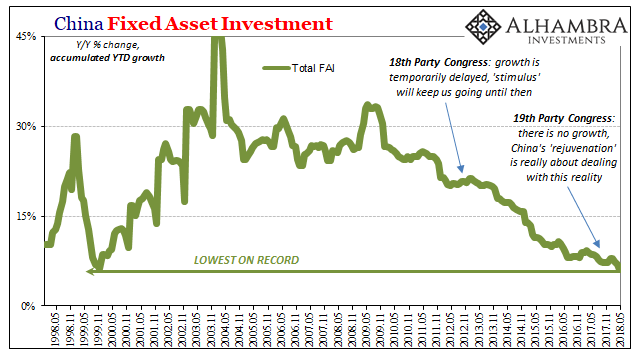
The last peak for Japan TIC shown above was, again, unsurprisingly, September 2017. The big drop happened in January 2018 just in time for global market liquidations. The pace has slowed but the direction remains.
This isn’t to say that angry conference calls should be held in accusing Japanese officials of something nefarious, rather its banks are merely the primary agent or symptom of continued unresolved systemic problems. That these have gone on unaddressed for eleven years tells us everything we need to know in order to properly assign blame (eventually).
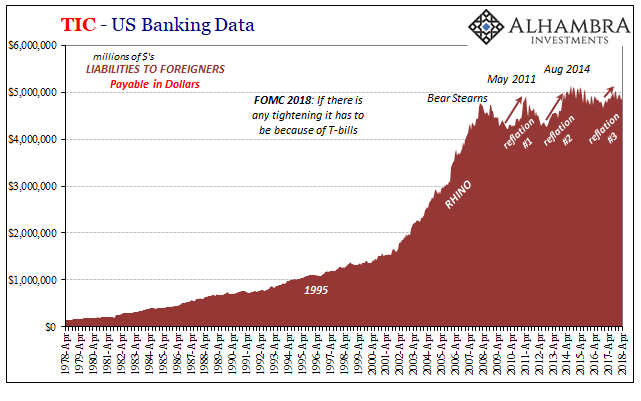
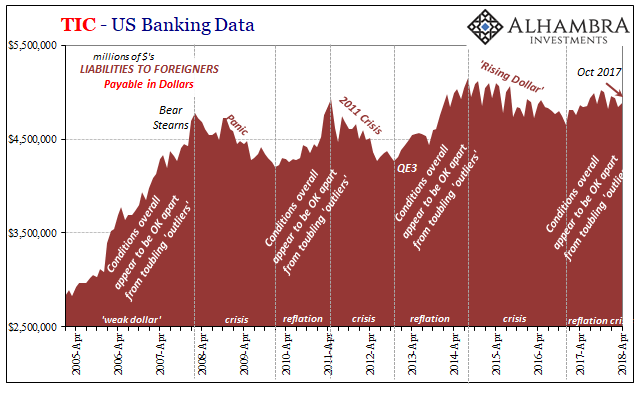
It’s always about opportunity and what’s going on in China (who really needs Japanese “dollars”) isn’t that. The world may be counting on the Chinese to fulfill “globally synchronized growth” but Japanese banks aren’t buying it. In fact, they are fleeing the narrative at an advanced, globally upsetting speed. Drain more supply from what’s already dry and the results are entirely predictable.
I wrote back in mid-September 2017:
The real question is what this all means, up to and including whether it marks like fails in June 2014 the start of whatever the next phase of eurodollar decay might be. We obviously won’t know anything like that for some time (and we have to be very careful about bias, meaning that since I suspect it, it’s easy to believe and see what I think is already there), but the biggest clue will be in escalating warnings like this.
In short, the worldwide “L” is catching up to a lot of different positions and perceptions all at once. Those were, in fact, warnings as to that effect. As noted earlier today, it has now gone to outline the edges of an end to Reflation #3; the same kind of ignominious expiration we’ve already seen three times before.
While much of the world fell ill to the Asian flu twenty years ago, this one today might be properly Chinese. In both cases, the diagnosis was the same: dollar.
