Index Futures Net Changes and Settlements:

Foreign Markets, Fair Value and Volume:
- In Asia 8 out of 11 markets closed lower: Shanghai Comp +0.20%, Hang Seng +0.40%, Nikkei +0.03%
- In Europe 9 out of 13 markets are trading lower: CAC +0.21%, DAX -0.03%, FTSE -0.15%
- Fair Value: S&P +4.88, NASDAQ +28.75, Dow +15.76
- Total Volume: 1.31 million ESU & 862 SPU traded in the pit
*As of 7:00 a.m. CST
Today’s Economic Calendar:
Today’s economic calendar includes the Empire State Mfg Survey 8:30 AM ET, Housing Market Index 10:00 AM ET, and Treasury International Capital 4:00 PM ET.
S&P 500 Futures: Rollover Rally; Will It Last?

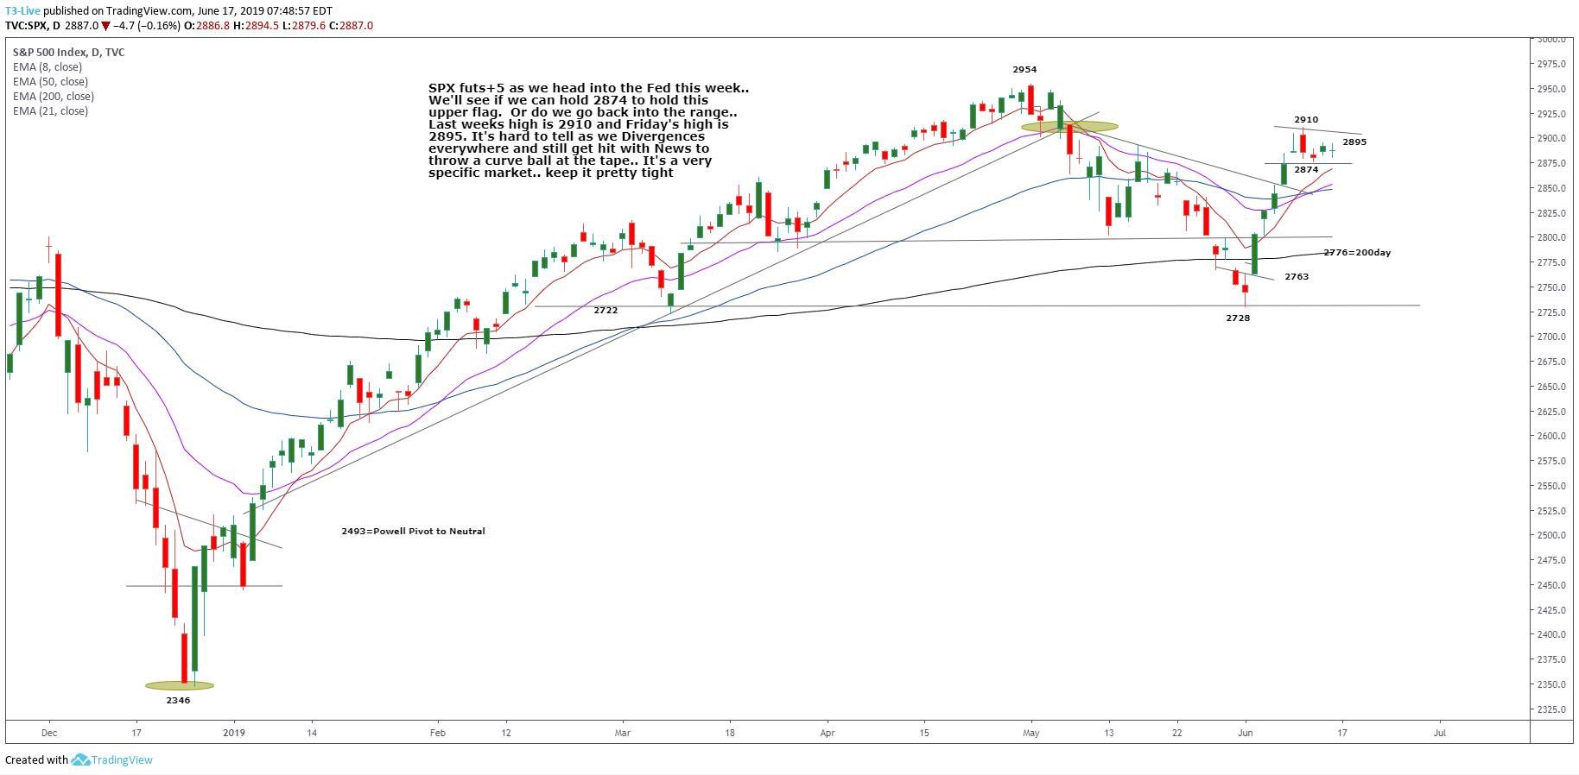
Chart courtesy of Scott Redler @RedDogT3 – $spx futs+5. We’ll see if we hold 2874 this week to keep upper commitment as we head into the Fed.
China says its not afraid of the tariffs, and won’t be ‘bullied’ by the U.S. Maybe I am wrong but it seems like there has been a lull in the headline news in the last week, and we all know that cant go on for very long!
This week is the fed’s two day meeting. There are still a lot of folks that think the fed is going to lower rates three times this year, but I just don’t see it, nor does Goldman and several other big investment banks. According to the CBOT’s fed funds there is a 77.5% the fed lowers rates on Wednesday. (https://www.cmegroup.com/trading/interest-rates/countdown-to-fomc.html)
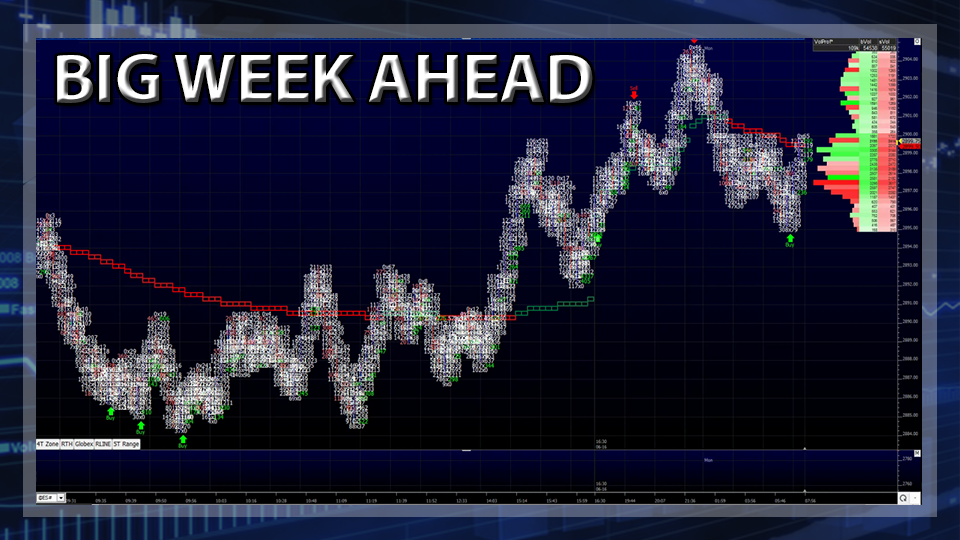
On Friday mornings 8:30 futures open the S&P 500 futures (ESU19:CME) traded 2893.00, and slowly pulled back down to 2884.25 going into 9:00 CT. After the low, the ES rallied back up to the vwap at 2890.50, sold back off down to 2886.00, and then rallied to a new high at 2893.00. After the high the ES sold off 8.5 handles down to 2884.50, one tick off the low of the day, and then rallied and double topped at the prior high at 289.0010:35.
Going into 11:30 CT, the ES made a high low at 2886.75, and had one last little rally and pullback before rallying 13 handles up to 2899.75, one tick shy of ES 2900.00 at 2:40. The MiM started out showing buy $250 million, and the ES went on to trade 2896.50 on the 2:45 cash imbalance reveal, then 2892.75 on the 3:00 cash close, and settled the day at 2894.75.
In the end, it was a great example of what to expect after the G20 at the end of the month. Historically, the summer is a time that traders withdraw money from their accounts and take the family on a vacation, and I am sure over the next few weeks thats whats going to happen. When it does, ES volume will drop under 800,000 a day, including globex. In terms of the ES’s overall tone, it acted fine, but I also think the lower volumes held that story. In terms of the days overall trade, only 1.3 million contracts traded.
