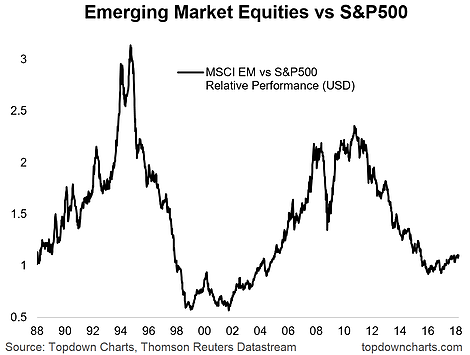
Emerging-market equities had a dream run since the bottom in 2016 (where, if you recall, they took a pummeling as a number of EM economies went into recession, China slowed, currencies crunched, and commodities crashed). But if you look at the long term cycles of EM vs US relative performance, it appears that EM equities may only just be getting started.
Indeed, as I highlight below, EM equities appear to go through 7-9 year cycles of outperformance, and 5-6 year cycles of underperformance. Looking at the charts it appears as though a new cycle of outperformance may be getting underway, and if the historical experience of this phase taking 7-9 years to play out continues, this could be a really key theme for investors to be across.
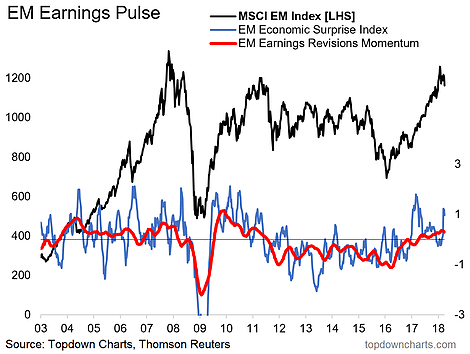
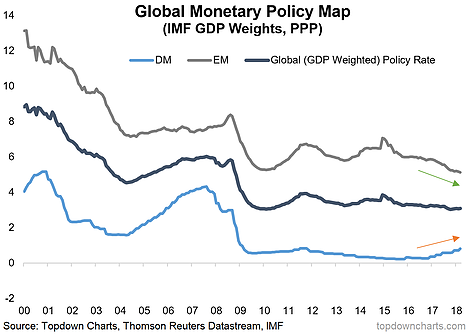
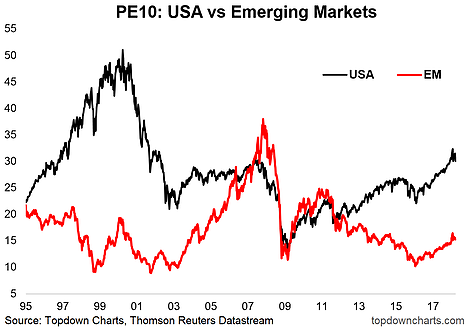
Bringing in some other data points, the EM equity earnings/macro pulse has been on the positive side for the past year, and cuts in monetary policy rates at an aggregate level across emerging market economies also reinforces the case for EM equities. Finally, the relative value picture also lines up with the observations around long-term cycles of under/out performance. Thus it presents an interesting short term and longer dynamic for the outlook.
The key takeaways on EM equities and outlook for relative performance against the S&P500 are:
-EM equities appear to go through long-term cycles of under/out performance vs US equities.
-The chart suggests that a new cycle of outperformance may be underway, and the earnings/macro/policy/valuation picture seems to support this assertion.
-Cycles of EM outperformance seem to take 7-9 years to fully play out, so this could be a key long term theme for investors.
1. MSCI Emerging Markets vs. the S&P 500: EM equities appear to undergo long term cycles of under/out performance against US equities. The first two up cycles in the chart below took 7 and 9 years respectively to complete, and the down cycles took 6 and 5 years respectively to complete. So we can deduce that down cycles are more rapid and up cycles are more prolonged. This is important context given we now appear to be in a new up cycle.

2. Emerging Markets Earnings Pulse: The chart below shows the path of EM earnings revisions momentum (a combination of earnings revisions ratio and rate of change in forward earnings), and the Citi EM economic surprise index (a gauge of how economic data is turning out vs expectations). Judging by history it's harder for EM equities to perform well when these indicators are on the downside, and when both are positive it's generally supportive.

3. Emerging Markets Monetary Policy Rate: One key factor that has been supportive for the EM earnings/macro pulse is easier monetary policy settings. In aggregate, EM central banks have been cutting interest rates - and this is in contrast to developed markets (primarily US), which have been hiking interest rates. Easier monetary policy generally is supportive for equity market performance in that it improves the cyclical economic outlook and also improves the liquidity/sentiment backdrop.

4. EM vs US Equity Valuations: Finally, a quick snapshot of where valuations are at shows that the relative value advantage is fairly one-sided when thinking about US vs EM equities. While in absolute terms you can't really call EM equities cheap vs their own history, there remains a substantial valuation gap vs US, and over the longer run PE10 readings can carry important forward looking information on expected returns. From an expected returns standpoint the graph below would be in favor of EM relative outperformance over the long run.

