Investing.com’s stocks of the week
by Pinchas Cohen
As an oil producer, the fate of the Russian ruble's exchange rate is tied rather closely to the price of oil, since importers buy the ruble to pay for the country's oil. And since Russia relies heavily on energy revenue to drive most of its economic growth, its markets are more sensitive than many other global markets to the commodity's fluctuations.
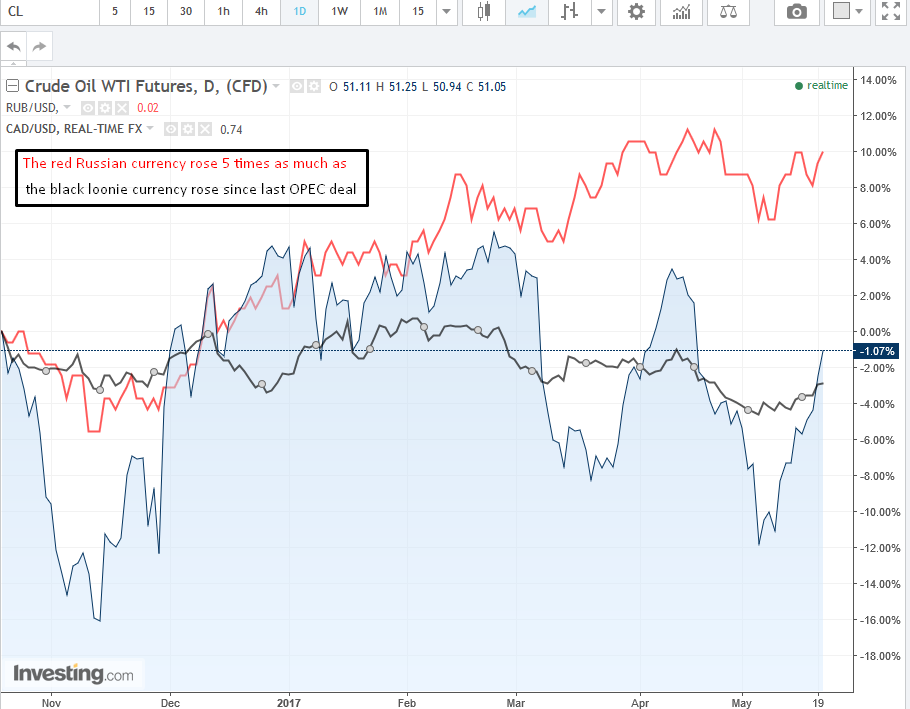
For traders who specialize in trading 'oil currencies,' the production freeze deal has had some interesting affects. Since OPEC’s November 30, 2016 deal, oil moved higher by 22.10%, gaining USD $10.00 until January 3, 2017. During that same period, the Canadian loonie rose 5.00% while the ruble rose 25.00 percent; five times more.

It’s understandable that the fate of Russia's currency would be tied to its top export. It would also be expected that rising oil should concurrently raise Russia's growth assets, its stock market.
However, while the Russian benchmark index, the MICEX, did in fact bottom along with oil, then rose alongside it till the beginning of 2017, since February it has not been a partner in oil’s rallies. Perhaps this can be attributed to U.S. President Donald Trump’s repeated rhetoric that he will encourage US production, which hurts Russia in two ways:
- US production drives down oil prices and
- US production discourages any Russian production increases
Case in point, the country's participation in the current 9-month production freeze extension.
Positive Price-Momentum Divergence
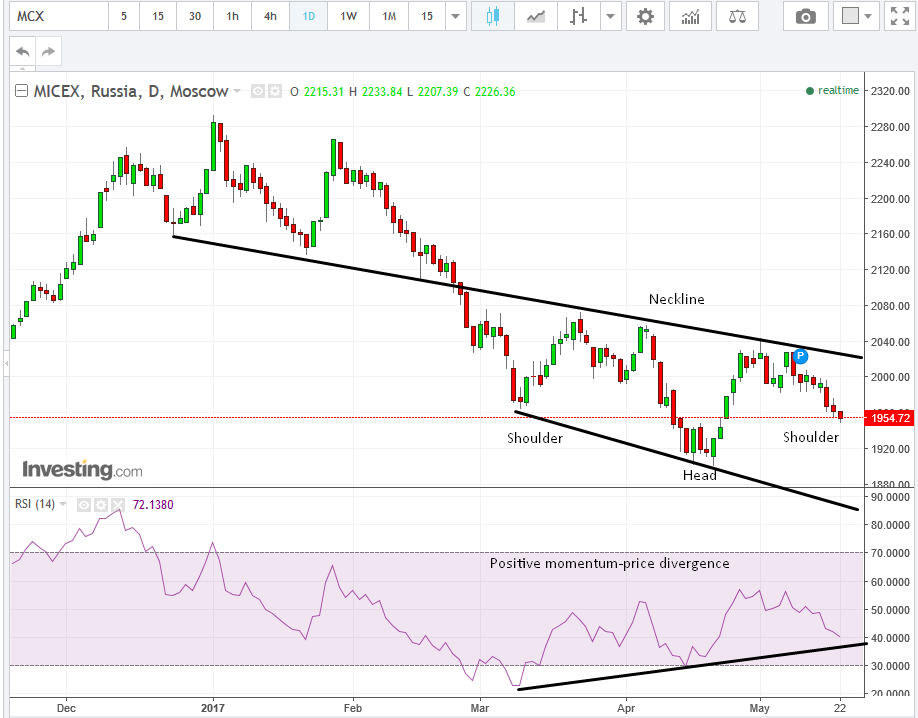
There could be other reasons at work though. The Russian stock market is considered grossly undervalued and there are indications that investors have been accumulating its shares—especially after a 16.75% decline since January 3. This could be signaled by the possible head and shoulders (H&S) bottom which has been forming since March 10, when the left shoulder’s low of 1965.23 was plotted on the chart.
The price then advanced to the high of 2072.91 on March 23. Up to this point, the price action has been following its down trend since January. However, after the price fell to the low of 1900.72 in early April, still resuming the down trend, the index returned to a high of 2044.24, near its previous peaks of March and April 6, when it hit at 2058.11 and the down trend’s continuation was put into question.
The validity of the H&S—although incomplete before an upside breakout of the neckline, which is at 2015—has been supported with a positive divergence. Momentum studies are leading indicators, in that they signal shifts before they actually take place in the price.
So, while the price declined between the left shoulder and the head, the Relative Strength Index, visible in the purple area of the chart below, advanced. This may be an indication that prices are about to advance too.
Notice as well, the momentum is reaching its uptrend line, which may suggest it’s about to turn up, and that may suggest that price is about to turn up also, possibly even create an upside breakout.

Trading Strategies
- Conservative: Conservative-risk oriented traders will probably wait not only for an upside breakout of the neckline, which at this point is at 2015, but also for a potential return move, as the price retests the now-support of the neck line. Only then will they go long, with a target price of 2130.
- Moderate: Moderate-risk oriented traders will probably go long upon the break of the neckline, without waiting for a roughly 65% chance of a return move, in case there isn’t one, as long as they are willing to stomach the risk of a return move.
- Aggressive: Aggressive traders will buy now, before the completion of the neckline with an decisive upside breakout.
