For some reason there seems to be a lot of people obsessed with—and almost losing sleep about—the level of US margin debt. In fairness, it made a new all time high in absolute nominal terms in February.
Is this something to worry about? And more to the point – is it the correct way to look at NYSE margin debt if you are actually trying to get an actionable market timing signal? I’ll save you time: No, and No.
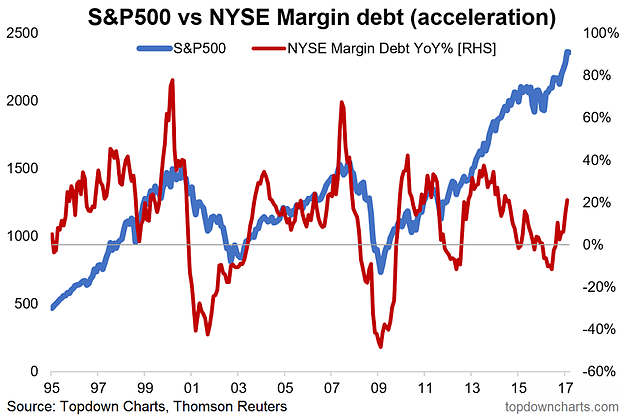
The chart below, from the latest Weekly Macro Themes report, shows what I consider to be the ‘correct’ way to look at margin debt if you’re actually interested in a meaningful market signal. This signal/indicator is pitted against the S&P 500 Index.

The chart above shows what I call margin debt acceleration – stay with me on this…
The reason I say acceleration is because that’s what really counts. You look at the chart and two things should immediately stick out: The spikes or rapid acceleration seen at the peak in 2000 and 2007. So that’s signal no.1: A rapid acceleration of margin debt (which reflects euphoria and a frantic rush to cash in on market returns).
At present there is no such signal of excessive acceleration.
The second type of signal comes from the opposite – deceleration. Massive and swift decelerations flagged the previous two major bear markets and flashed orange warning lights two times in the post-crisis period. These turned out to be ‘false alarms’ but did flag a period of consolidation and volatility.
On signal no.2 there is no sign of excessive deceleration.
So as I hinted earlier on, this is what I think is the best way to look at margin debt if you want to actually get a useful market timing signal. And for the two major types of signal, there is nothing to worry about on this indicator alone at this point. Of course it’s no reason to get complacent, and you can be sure I will be watching this one closely and keeping my clients up to date on any changes!
