By Pinchas Cohen
Barclays: Worst Performing Stock Of The Worst Performing Sector
Yesterday’s disappointing FOMC meeting – in which Chairwoman Yellen had to reiterate that inflation isn’t rising as fast as the Fed had been counting on – prompted dollar traders to sell, sovereign bond traders to buy and halted the binge shopping of equity traders. Naturally, the sector to bear the brunt of the action was financials. The S&P 500 Financials Index, the worst performer among S&P sectors, declined 0.61 percent.
While US financials may be lagging, when compared to US banks, European banks are thriving. While the S&P 500 Financials Index climbed 8.16 percent this year, iShares MSCI Europe Financials (NASDAQ:EUFN) pushed almost three times higher, up 22 percent.
However, despite the general strength of European banks, Brexit isn’t helping Britain’s biggest bank and neither is a possible consumer credit bubble. Barclays (NYSE:BCS, LON:BARC), which is the worst performing European bank of 2017, reports earnings tomorrow, Friday, after market close.
Barclays is flat YTD 2017, a disgraceful 0.4 percent gain for the 325-year old bank. As well, expectations are continuously being lowered, with JPMorgan Chase analysts forecasting that Barclays fixed-income trading has fallen 16 percent this year.
In May, the bank’s CEO Jes Staley said that his bank may need another year-and-a-half before it generates an acceptable return on equity for investors.
Barrage of Bad Publicity
If adverse business conditions aren’t enough, the bank must contend with a barrage of negative publicity as well:
- The UK Financial Conduct Authority is investigating CEO Staley’s attempts to unmask a whistle-blower.
- The Serious Fraud Office charged Barclays and four of its former executives with conspiracy to commit fraud related to its 2008 capital raising from Qatar.
- It is defending itself from a multibillion dollar fine levied against it by the US DoD for its contribution to unfair sales practices of mortgage-backed securities that helped trigger the crash of 2008.
- The bank is expected to announce the closure of non-core units, which includes extreme high-risk assets, and reintegrate the remaining 25 billion pounds of risk-weighted assets into its core business.
- A judge ruled that Barclays would be liable in a lawsuit brought by 126 people, if it is proven that a doctor sexually assaulted prospective employees while performing medical examinations on behalf of the bank.
- In April, customers were unable to access their accounts for thirteen hours during maintenance.
- Clients could be charged as much as $455,000 a year for the bank’s highest level of equity analysis, which is currently free as part of a package deal.
- Barclays plans to close the last remaining bank, on of its own outposts, in the small English town of Castle Cary, leaving its elderly customers stranded.
Unfortunately for Barclays, its technical outlook isn't very promising either.
Technical Perspective

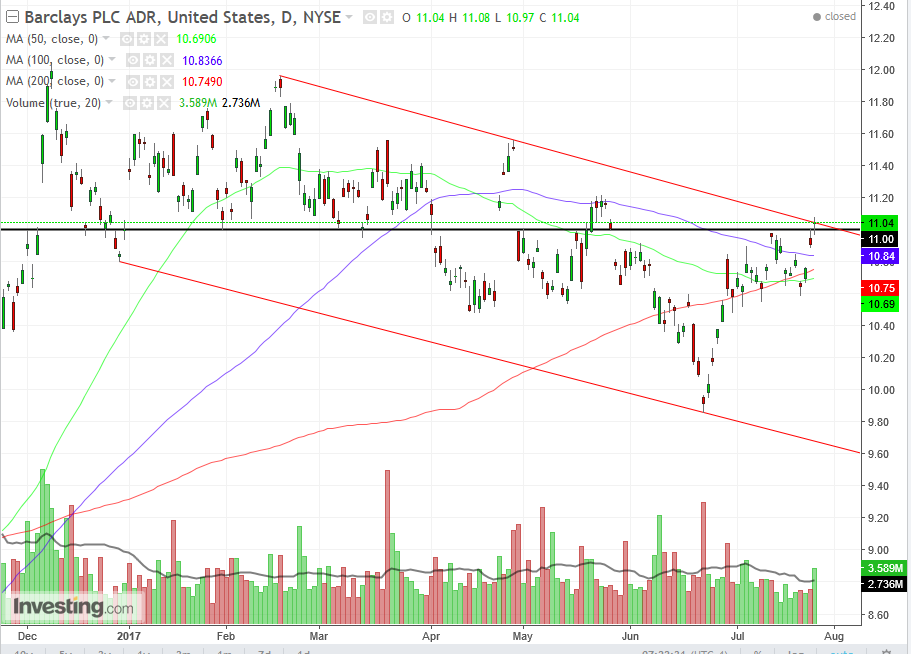
The price is flat YoY, after rallying 12 percent from the June 22 low of $9.86. Yesterday’s closing price was stopped at the top of the falling channel, in which it has been trading for the year. The top is the downtrend line, where sellers are expected to have been waiting for another shorting opportunity.
The rally may have ended at the $11.00 price level, because of an additional resistance, this one at the price at which the stock opened this year. Traders may remember it, and see how dismally the price has been doing lately. Disgusted long traders may be all too eager to dump the stock after the recovery from under $10, in order to get out even, while bears noticing the pattern may short it.
Yesterday's trading formed a High Wave candle. This may also called the “fear candle.” Prices swing up and down, but close near the opening price, as investors rush here and there on any rumor or notion but ultimately end up doing nothing. The flurry created a lot of volume, as you can see in the chart, but it lacks leadership. This candle generally appears at the end of a move, and it’s telling that it was formed at the intersection of the opening price of the year and the channel top.
While the prices managed to rise above the major moving averages, the 50 dma crossed below the 200 dma. The last time this happened, in late 2015, the price dropped nearly 60 percent until late June 2016.
Trading Strategies
Conservative traders may wait on a short for a close lower than yesterday’s $11.04, while a close lower than yesterday’s $10.97 low would be more conservative, to confirm the double-resistance of the year’s opening price and channel top, with a stop-loss over yesterday’s $11.08 high price.
Moderate traders may wait for a lower open before shorting.
Aggressive traders may short immediately.
