by Pinchas Cohen
The S&P 500 fell 0.1 percent on Wednesday, with Exxon Mobil (NYSE:XOM) and Chevron (NYSE:CVX) caught in the oil tsunami that's drowning the markets. Supply gluts and attendant price slides in crude have become cement shoes for the energy behemoths, weighing on shares and pulling them lower.
Let’s look at the fundamentals of Exxon Mobil:
- The stock price is near its lowest level of the year, trading at $104.19. That's only 1.3 percent from the lowest close of the year on June 2 and less than 2 percent from the low of the year, at 102.55, on June 7.
- The stock is undervalued, with a price/earnings to growth ratio of less than 1.
- Diversification reduces exposure to oil – While its primary income has been from upstream projects—searching and drilling for crude oil—the company’s integrated business model includes downstream projects – refining crude oil – which affords the company exposure to the commodity beyond exploration and extraction. Thanks to hedging, Exxon Mobil outperformed other oil companies when oil crashed 75% between June 2014 and February 2016.
However, that business model didn’t seem to set it apart from other oil companies yesterday, when it led the decline of the S&P 500.
Though the equity didn't suffer as much during the initial oil collapse, currently it appears to be taking the brunt of the stress to oil markets. As well, when oil's price tumbled the first time, investors couldn’t conceive of oil—which was above $150 before the 2008 crash and above $107 during June 2014— imploding all the way down to $26, losing 75% of its value. But this time, investors are wary.
With a never-ending, rising US oil supply, as US shale companies reportedly hedged their bets, guaranteeing $50 a barrel, irrespective of oil market price, investors are remembering 2015.
XOM Technicals

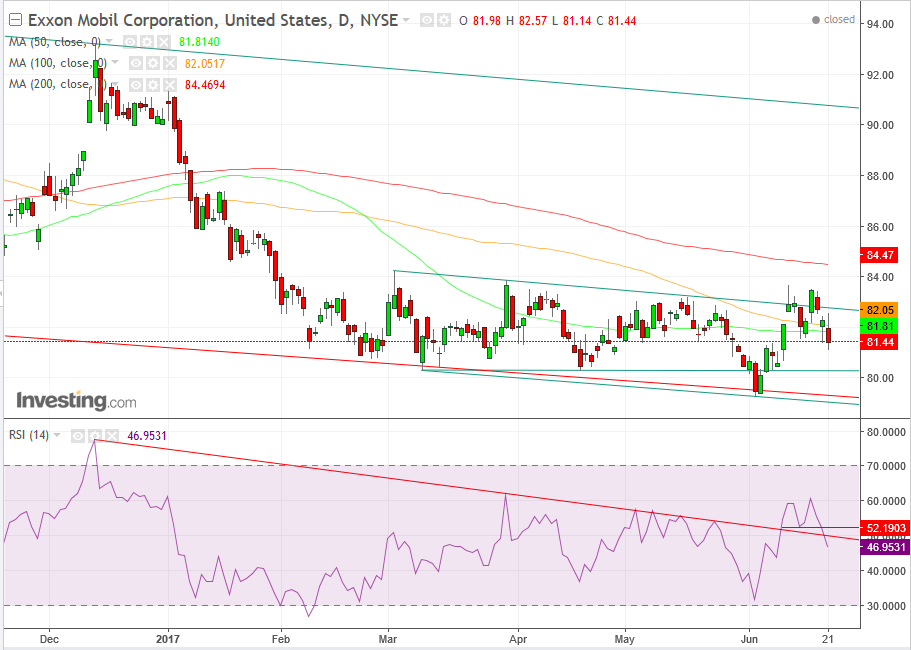
Here's what Exxon Mobil's technicals look like:
After reaching the $79.26 low of the year on June 2, dropping nearly 15% since the height of $93.22 on December 13, it looked like the trading pattern was forming a base.
On June 12 though, the stock leaped on a gap, creating an upside breakout of the base, when investors shifted investments out of tech growth stocks and into energy value stocks. The dramatic price move was supported by an upside break in momentum, as was confirmed by a breakout of the Relative Strength Index.
Nevertheless, it couldn’t maintain its gains, and closed back under the top of the base, creating a bearish shooting star. By June 14 the stock had slipped to $81.56, at which time the Relative Strength Index completed a double top and also fell back into the congestion of the base, making the failure of the price breakout all the more glaring.
Still, the stock gave the breakout another go, and although it didn’t surpass the shooting star’s resistance, it at least closed above the top of the base. However, and yet again, it couldn’t maintain its gains, falling over the next three days, until yesterday, to a close of $81.44, once again, confirming and reinforcing the shooting star’s resistance and the leading signal of the Relative Strength Index.
The initial breakout attempt on June 12 leaped over the 50 and 100 dma. Even after the shooting star was formed and the price fell, it remained above them. Yesterday though, it fell back beneath them, while the 200 dma (red) remained above the base the entire time, now at $84.47, as if guarding the exit.
The one thing bulls have going for them now is Tuesday’s trading pattern, which formed a bullish hammer, and is meant to provide support. Yesterday’s trading, despite falling lower on an intra-day basis, closed 3 cents above the hammer’s support.
Trading Exxon Mobil
Conservative traders would wait on a short for either a correction to the resistance of the shooting star, confirming the resistance of the pattern, at $83.69, or for a break of Tuesday’s hammer at $81.41, with a close on a meaningful filter. Should they wait for the corrections, traders could place the range between the resistance of the shooting star, the high of $83.69 and the support of the hammer at the low of $81.41.
Moderate traders would wait for a correction of yesterday’s high at $82.57 or a close beneath the hammer.
Aggressive Traders would short now.
Money Management: Stop losses are to be placed according to the trader’s account, at the levels specified with regards to support and resistance.
The $80 price level would likely provide a staunch support, and the June 2 low of $79.26 will be crucial for the stock’s future. It would be between continuing the base within a reversal pattern and between catapulting the price to deeper depths.
